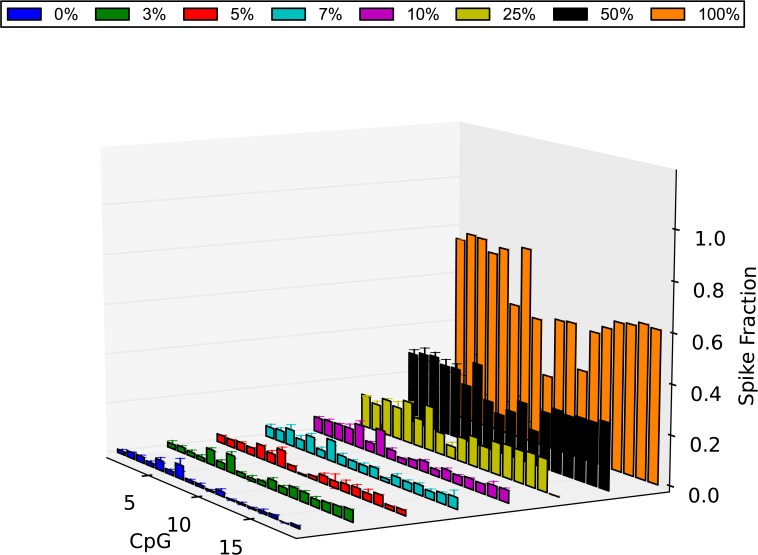
Fig 8. Methylation level of the EP6 DMR as determined by NGS.
The methylation level of all the CpG sites of the amplified region of the EP6 DMR is plotted for all the spikes. Shown is the average value of each CpG in each spike as was calculated from 3 technical replicates (CVS 0% = blue, 3% = green, 5% = red, 7% = light blue, 10% = purple, 25% = yellow, 50% = black, 100% = orange). In order to calculate statistical significance of the methylation level of each spike, we created a dataset of average performance for each spike group and we compared these average performance datasets with the 0% CVS average performance set using a t-test. It was demonstrated that all the small spikes showed significantly higher methylation levels than the 0% CVS group [3% (P = 0.004), 5% (P = 0.004), 7% (P = 1.107e-05), 10% (P = 4.458e-06)]. Error bars = SD.

