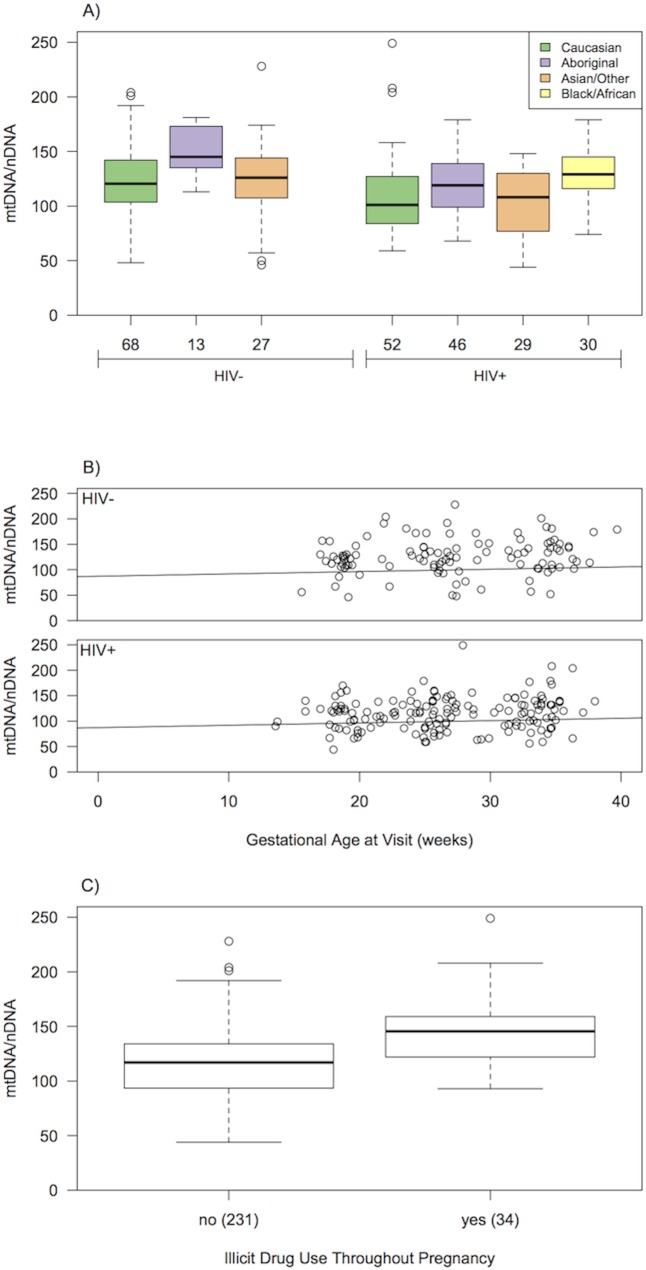
Fig 1. Significant associations between mtDNA/nDNA ratio and variables of interest for both HIV- and HIV+ cohorts (N = 105).
(A) Ethnicity, (B) GA at visit (weeks) and (C) Illicit drug use. In A and C, the horizontal line in the boxplots indicates the median value, boxes represent the interquartile range, whiskers indicate 1.5 times the interquartile range, while points indicate outliers. In B, the best-fit line from the mixed-effects model controlling for platelets and other significant variables is shown. All samples were collected during pregnancy.

