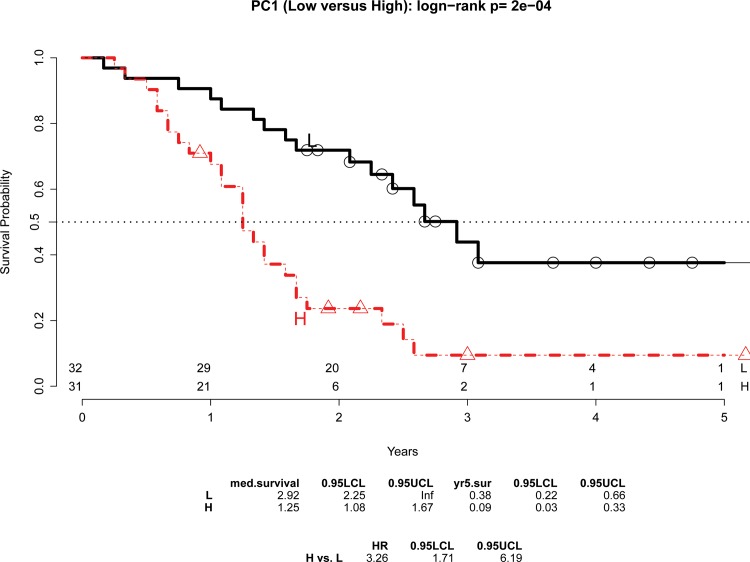
Fig 1. Association of the 15-gene signature with overall survival in the Moffitt cohort.
A PC1 score was generated for each patient from the Moffitt cohort (n = 63) by principal component analysis to reflect the combined expression of the 15 genes. High and low PC1 groups were determined on the basis of a median split. Kaplan–Meier curves of overall survival are shown in the two groups. A statistically significant difference of the Kaplan–Meier survival curves between the high and low PC1 groups was determined by the two-sided log-rank test. The number of patients at risk is listed below the survival curves.

