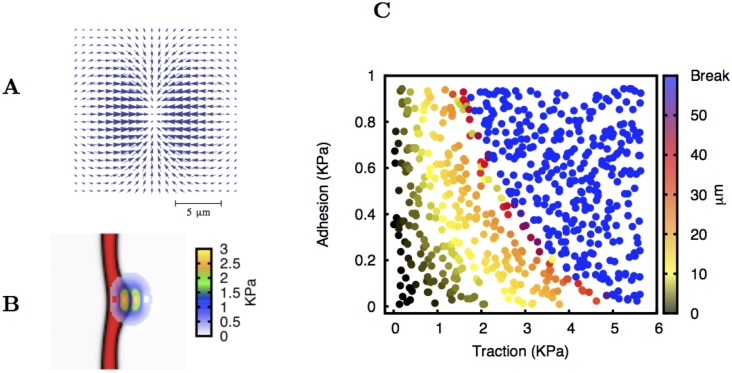
Fig 2. Formation of a single sprout without endothelial cell proliferation.
Plate A: The contractile force field that is created by the tip cell is oriented along the direction of the VEGF gradient. Here we consider this force distribution, akin to the traction force field observed by in vitro experiments [20]. The typical size of the force region is the same as the size of an endothelial cell. Plate B: The centre of the force field is located at the border of the original vessel. In this figure a sprout is already forming. The local intensity of the traction force exerted by the tip cell is indicated. The maximum traction force in this case is 3.0 KPa. Plate C: Length of the sprout after 14.5 hours plotted as a function of the maximum tip cell traction force and adhesion coefficient. After that period of time we observe that the sprout almost does not increase its size. The values for adhesion and traction tested are chosen randomly within the studied interval. The length of the sprouts increases with the traction force applied. For large values of adhesion and traction force the tip cell pinches off.

