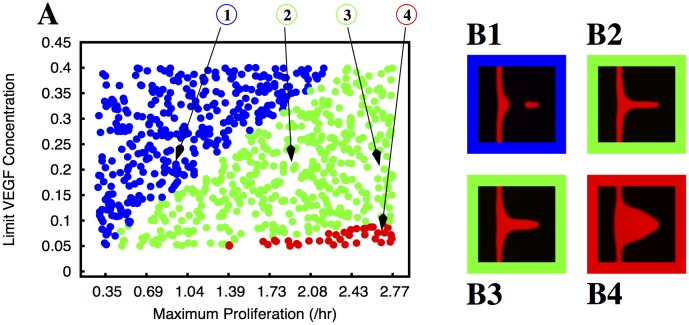
Fig 7. Morphology of the growing sprouts with endothelial cell proliferation dependent on VEGF concentration but triggered by local strain.
In plate A we indicate the morphology of the growing sprout (by using different colours) for different values of maximum proliferation (M P) and limit VEGF concentration (L V). In these simulations the proliferation rate increases linearly with the VEGF concentration until it reaches its maximum value M P at the concentration L V, but is only different from zero where the strain is larger than a cut-off S m = 0.05. The colours indicate the morphology of the observed sprouts for the corresponding parameters: blue dots correspond to situations where the sprout breaks, the green dots correspond to well formed sprouts without appreciable thickening of the parental vessel, and the red dots correspond to deformed vessels (i.e. triangular sprouts). We observe that the sprout breaks for low proliferation rates, but there is a very large region of the parameter space with well formed sprouts. In plates B1, B2, B3 and B4 we plot examples of the morphologies observed (the color of the border in these plates follows the same code as in plate A). The parameters used to obtain the morphologies depicted in B1, B2, B3 and B4 are indicated by arrows in plate A.

