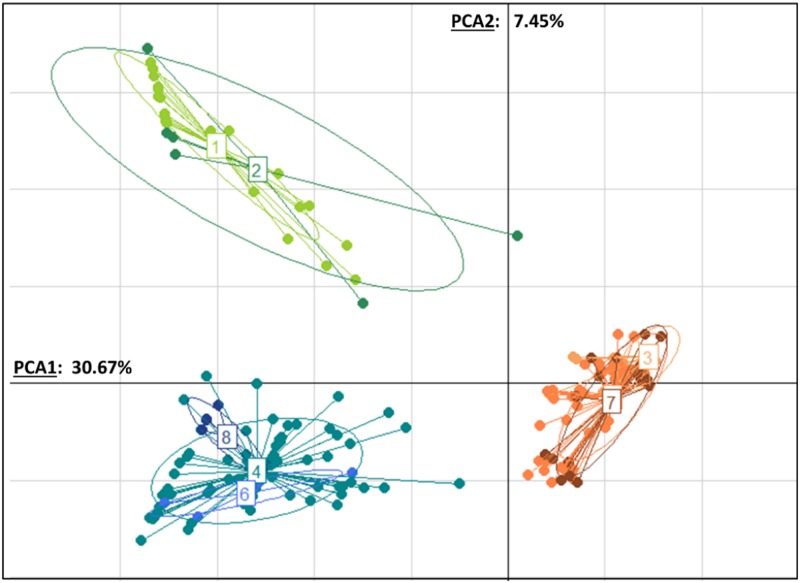
Fig 2. Principal Component Analysis.
Genetic clustering of the Varroa mites based on their genotype at six microsatellite markers. The Varroa mites were sampled in A. cerana (Vc) and A. mellifera (Vm) colonies in the Philippines and Vietnam. The genotypes of the mites sampled in Los Banos (LB) are shown in green (groups 1 and 2). The mites from Lipa city (LC, group 3) and sampled in A. mellifera from Dien Bien (DB, group 5) and Son La (SL, group 7) are represented in orange. The mites from A. cerana colonies located in Vietnam from Dien Bien (DB, group 4), Son La (SL, group 6) and Cat Ba (CB, group 8) are represented in blue. Each dot represents a distinct individual, and each inertia ellipsoid shows the population’s prediction ellipses for each group.

