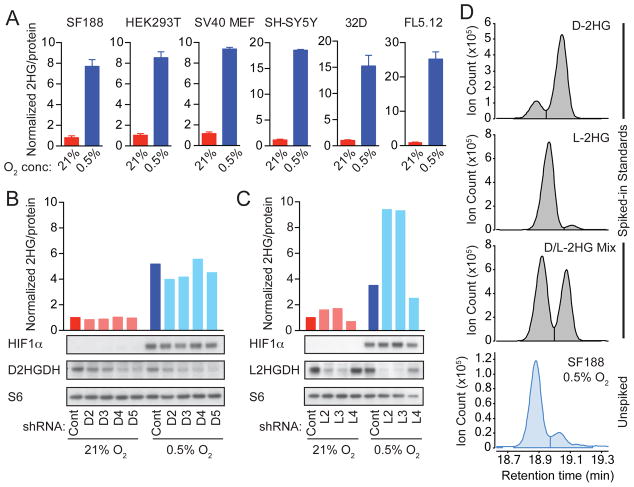
Figure 1. L-2-Hydroxyglutarate (L-2HG) Production in Response to Hypoxia.
(A) The indicated cells were cultured for 24 to 48 hr in 21% or 0.5% oxygen (O2). Total intracellular 2HG was measured by gas chromatography-mass spectrometry (GC-MS) and normalized to total protein to control for input. The 2HG level for each cell type in 21% O2 is arbitrarily set to 1 to illustrate fold change. Graphs show mean +/- SD of triplicate samples. (B and C) SF188 cells were stably infected with lentiviruses expressing non-targeting shRNA (Cont), shRNAs targeting D2HGDH (D2, D3, D4, D5), or shRNAs targeting L2HGDH (L2, L3, L4). Cells were cultured for 48 hr in 21% or 0.5% O2, and 2HG was measured as in (A). Western blots show expression of HIF1α, D2HGDH, L2HGDH, and S6 protein (loading control). (D) Metabolites from hypoxic SF188 cells were divided into 4 fractions, then spiked with reference standards of D-2HG, L-2HG, a mixture of D- and L-2HG, or left unspiked. Chiral derivatization was performed to allow separation of 2HG enantiomers by GC-MS. For each panel in this figure, representative data from 1 of ≥3 independent experiments are shown. See also Figure S1.

