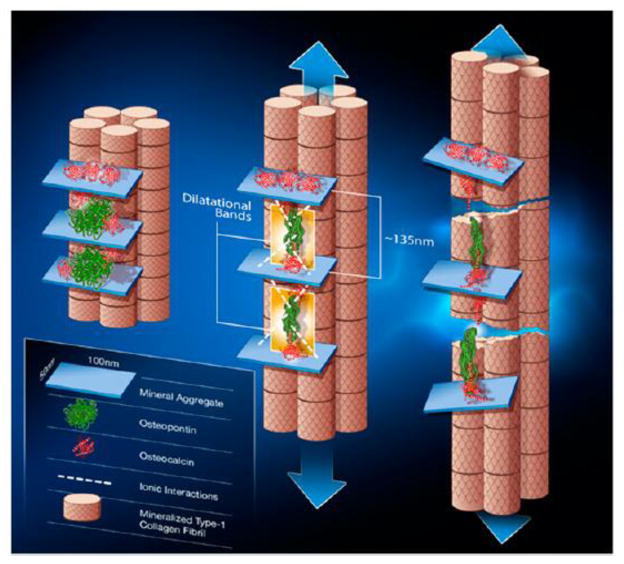
Figure 4.
Schematic of the OC-OPN-OC complex at the organic-mineral interface in bone. The first stage (left) illustrates two sites of dilatational band formation. Each site comprises two OC molecules (red) and an OPN molecule (green). The OC and OPN molecules are sandwiched between two fused mineral aggregates. Application of a load (center) causes the OC-OPN-OC protein complex to unfold. Dilatational bands (highlighted in yellow) form and extend until the maximum extension of 135 nm is reached. Continuous loading causes OC and OPN to separate (right). The separation of OC and OPN dictates the subsequent rupture and shear of collagen fibrils. Shear is shown by the difference in longitudinal displacement of the fibrils. From Poundarik et al [22] with permission obtained from PNAS.

