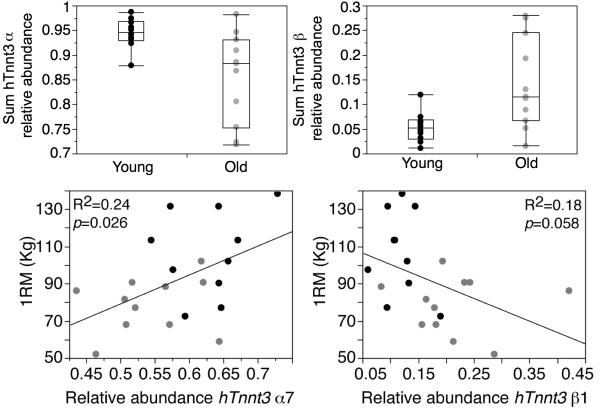
Figure 2.
Top: Sum of relative abundance for all hTnnt3 α (left panel) and β (right panel) spliceforms in vastus lateralis muscle of old and young subjects (p = 0.0084). Bottom: least squares regression of muscle performance (1RM) and the relative abundance of splice forms hTnnt3 α7 (left panel) and hTnnt3 β1 (right panel). Fitting parameters as follows: hTnnt3 α7: R2 = 0.24, p = 0.026; hTnnt3 β1: R2=0.18, p = 0.058. N = 21. Grey symbols, older subjects; black symbols, young subjects.

