
Figure 2. Conformational exchange detected by NMR relaxation dispersion.
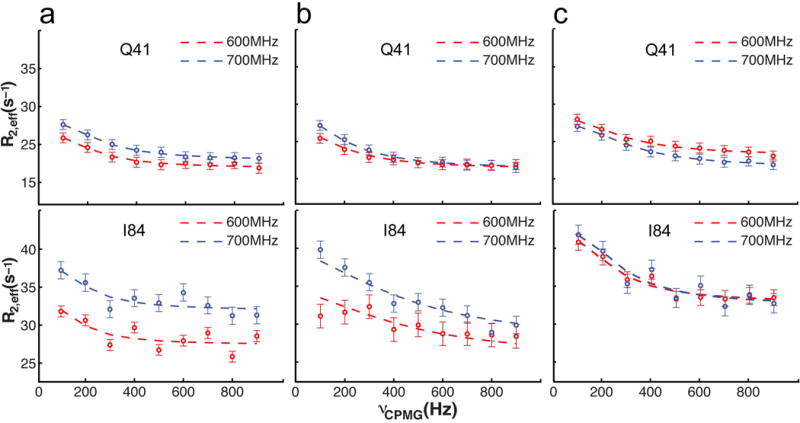
Examples of 15N relaxation dispersion profiles for Gln41 and Ile84 measured at 1H frequencies of 600 (red circles) and 700 (blue circles) MHz. Error bars are ± one s.d. values (n=4) determined from repeat experiments.
a. Relaxation dispersion of yAAC3 in the absence of ligands.
b. Relaxation dispersion of yAAC3 in the presence of 10 mM ADP.
c. Relaxation dispersion of yAAC3 in the presence of 3 mM CATR.