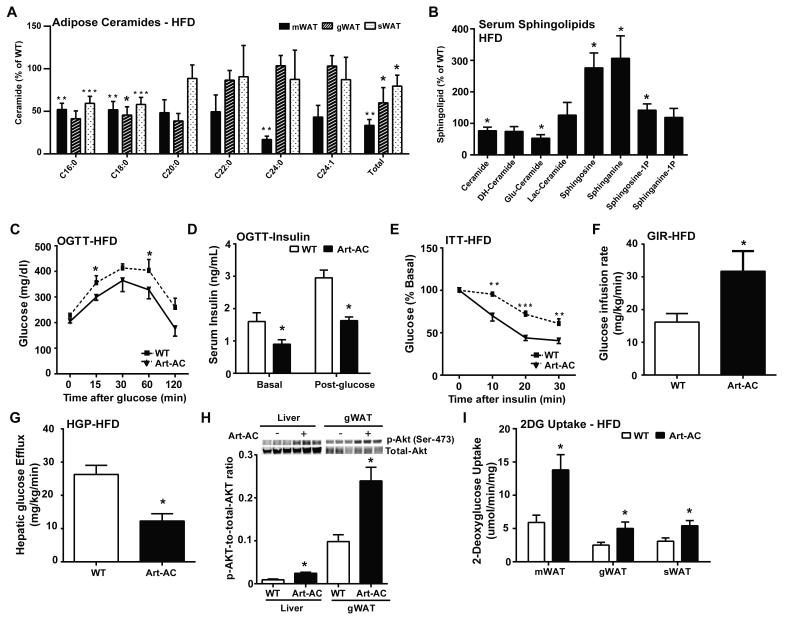
Fig. 3. Inducible adipose-specific overexpression of acid ceramidase results in ceramide species in the adipose and improved total body glucose homeostasis and insulin sensitivity under HFD feeding.
A) Analysis of ceramide species of the indicated chain lengths from mesenteric (m), gonadal (g) and subcutaneous (s) fat pads from Art-AC mice and WT littermates. B) Analysis of total ceramide and sphingoid species from serum of Art-AC and WT littermates . C) Circulating glucose levels were measured during an oral glucose tolerance test (OGTT) (2.5 g/kg glucose per oral gavage). D) Serum insulin levels before and 15 minutes after oral glucose. E) Circulating glucose levels measured during an insulin tolerance test (ITT) (0.75 U/kg). F) Glucose infusion rates during hyperinsulinemic-euglycemic clamp experiments performed on conscious unrestrained 14-week-old WT and Alb-AC males (n = 6 mice). G) Hepatic glucose efflux during hyperinsulinemic-euglycemic clamp experiments performed on conscious unrestrained 14-week-old WT and Alb-AC males (n = 6 mice). H) Representative immunoblots of phosphorylated and total Akt of insulin-stimulated livers and gWAT of WT and Art-AC mice, shown in triplicate. I) 2-deoxyglucose uptake into fat pads of WT mice and Art-AC mice was assessed during the hyperinsulinemiceuglycemic state (n=6 per group). All samples are from Alb-AC mice and WT littermates after 8 weeks of HFD –dox challenge (n = 6-8 per group). *P<0.05, **P<0.01, ***P<0.001 by Student’s t test.

