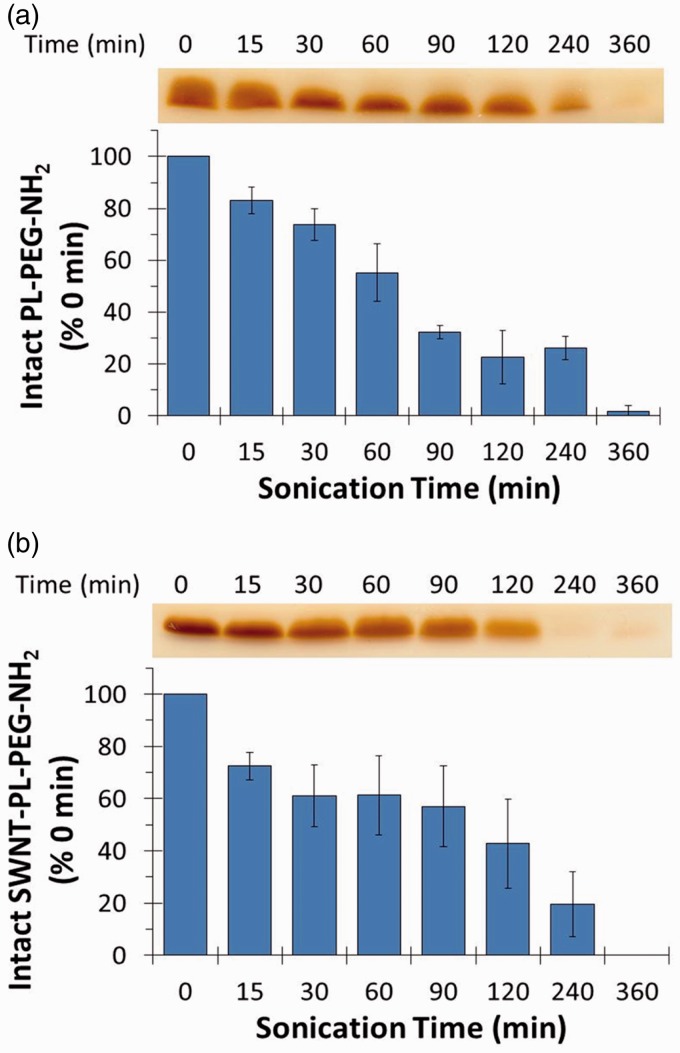
Figure 3.
Sonolytic degradation of DSPE-PEG-NH2 in the presence or absence of SWNTs. DSPE-PEG-NH2 was sonicated alone (a) or with 0.5 mg/mL of SWNTs (b) for the indicated times. Samples were analyzed by SDS-PAGE followed by BaI2 staining and quantification of band intensities as described in the “Materials and methods” section. (A color version of this figure is available in the online journal.)

