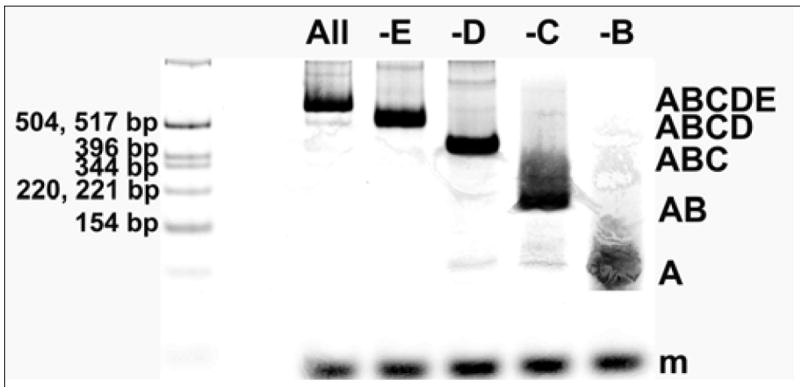
Figure 3.

Native PAGE on tile reaction mixtures where Tile A is fluorescently labeled with ATTO633. The leftmost lane is a fluorescein-labeled molecular weight marker and each lane contains a 70 base-pair scaling marker labeled with fluorescein. Tiles were mixed in TAE/10.5 mM Mg2+ buffer and incubated 16 hours at 16° C. Major product complexes of expected size formed in each case when a tile was omitted or with the full tile set. Complexes formed are indicated at the right side of the image. Lane contents are as follows, where an underscore marks the addition of buffer in place of a missing tile, and the percentage of total lane contents according to gel analysis using ImageQuant.net software: (1) molecular weight marker fluorescein labeled (2) ABCDE (3) ABCD_ (4) ABC_E (5) AB_DE (6) A_CDE. This gel is highly enhanced to show minor products. The fluorescence intensity of the product band in each lane is adjusted by the intensity of the scaling marker in the same lane and the percentages of products formed (from an average of 2 reactions) are the following: Lane 2, ABCDE: 70.5%, Lane 3, ABCD: 80.5%, Lane 4, ABC: 87.5%, Lane 5, AB: 90.5%, Lane 6, A: 100%. Average step-yield, 91.6%.
