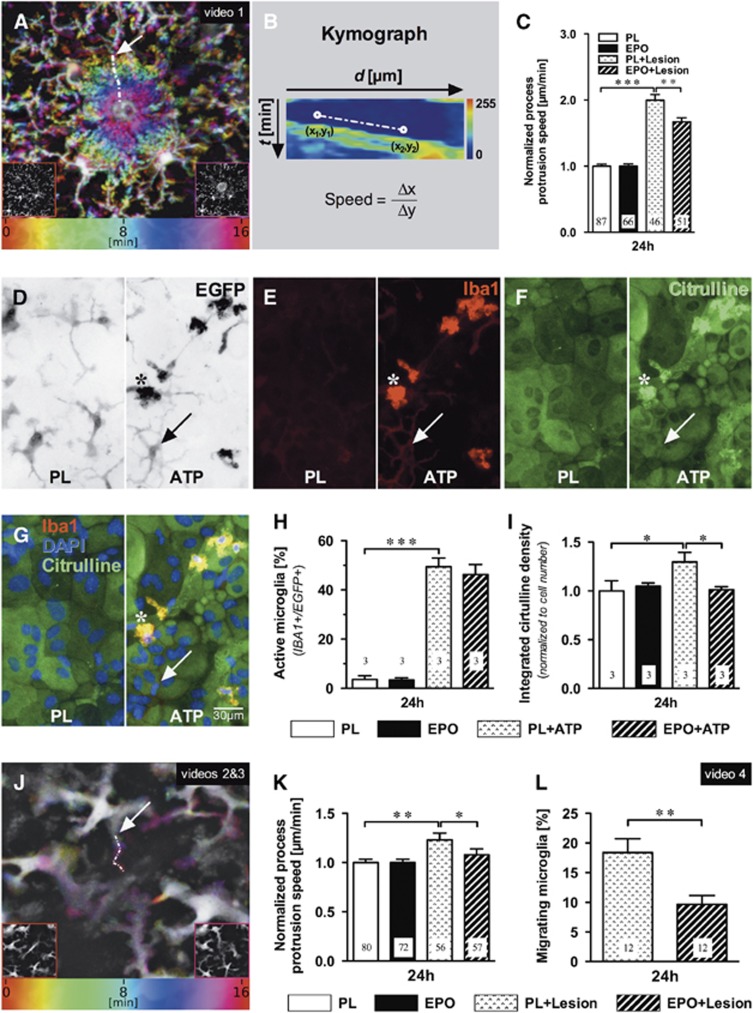
Figure 1.
Erythropoietin (EPO) effects on cortical microglia in vivo and on microglia in mixed cultures. In vivo: (A) Microglial processes converge onto a central laser lesion (colors represent time). Lower left and right insets illustrate pre- and post-laser lesion views (see Supplementary Video 1). (B) Process movements were traced (arrow in A shows exemplary path) and sampled to create kymographs, whose slope corresponds to the process protrusion speed. (C) Laser lesion-induced process protrusion was higher than basal motility, but reduced by 24 hours EPO pretreatment (5 IU/g intraperitoneally), compared with placebo (PL). Numbers of analyzed processes from 4 to 5 independent experiments each are given in the bars. Mean±s.e.m. presented, **P⩽0.01, ***P⩽0.001 (two-tailed t-test). In vitro: (D to G) Representative images of surveilling (placebo, PL) and ATP-stimulated microglia: EGFP fluorescence (D, inverse signal), Iba1 (E), L-citrulline (F), overlay plus DAPI (G); arrows denote a weakly Iba1-stained, L-citrulline-negative ramified microglia; stars designate a strongly Iba1+/L-citrulline+ cell. (H) Increase in strongly Iba1+/EGFP+ microglia under ATP (300 μmol/L, 2 hours) and (I) reduction of ATP-stimulated L-citrulline by EPO pretreatment (3 IU/mL, 24 hours); numbers of independent experiments are given in the bars. (J) Microglia send processes to a central laser lesion (colors represent time). Insets correspond to pre- and post-laser lesion time points. (K) Kymograph-derived speed measurements (arrow in J shows exemplary path, see Supplementary videos 2 and 3) indicate increased process protrusion rate upon laser lesion, which was reduced under EPO (3 IU/mL, 24 hours). (L) Under EPO, a lower percentage of microglia migrates toward the laser lesion (Supplementary video 4). Numbers in bars refer to analyzed processes (K) or independent cultures (L). Mean±s.e.m. presented, *P⩽0.05, **P⩽0.01, ***P⩽0.001 (one- or two-tailed t-tests).

