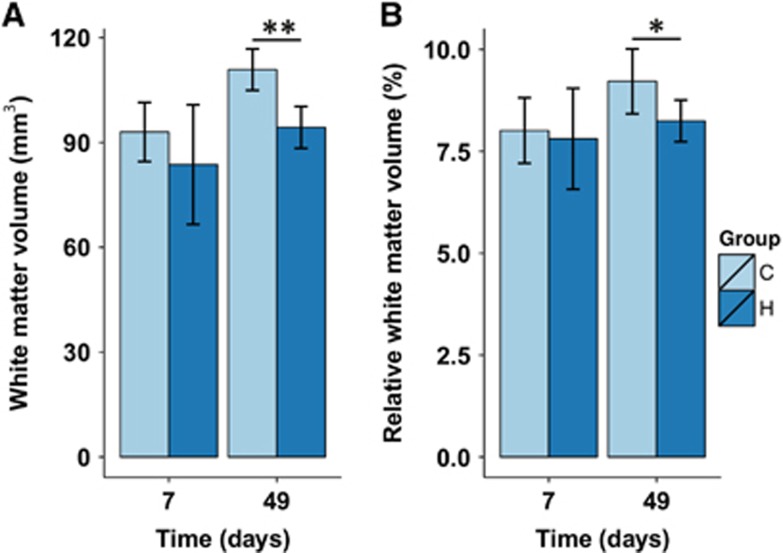
Figure 3.
Absolute and relative contralateral white matter volumes. (A) Absolute contralateral white matter volume at day 7 and 49 in control (C) and hemispherectomized (H) rats. (B) Contralateral white matter volume relative to total contralateral hemispheric volume (this corrects for total brain volume as a potential confounder for white matter volume differences between control and hemispherectomized rats). Bars represent group mean±s.d.; *P<0.05; **P<0.01 versus controls as revealed by post-hoc analysis.

