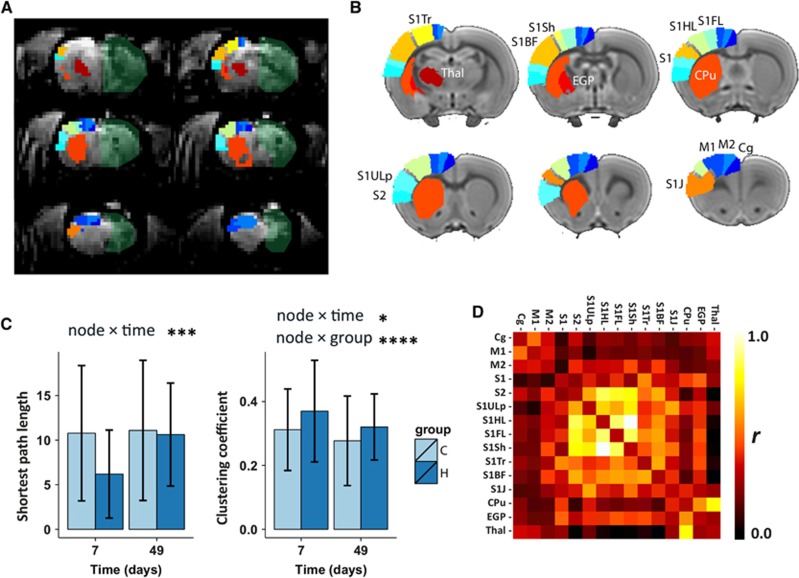
Figure 6.
Contralateral sensorimotor network features. (A) From the Paxinos and Watson rat brain atlas, 15 cortical and subcortical sensorimotor regions were selected and projected on coronal slices of a representative resting-state BOLD image (not processed) from 1 of the animals at day 47. The removed hemisphere is marked as a semi-transparent green area. (B) The same sensorimotor regions, with identical color coding, are also projected on coronal slices of the left (contralateral) hemisphere of the rat brain template used for registration (one color per region and summarized in Supplementary Table 1). Each region represents a single network node in the weighted graph analysis. (C) Weighted shortest path length (left) and weighted clustering coefficient (right), averaged over all network nodes at two time points (7 and 49 days) in the control (C) and hemispherectomy (H) group. Statistical node × group and node × time output from the nested multilevel analysis are shown for significant nodes only. Bars represent group mean±s.d.; *P<0.05; ***P<0.001; ****P<0.0001 versus controls. (D) Example of Pearson's correlation (r) matrix for the 15 sensorimotor network nodes. The rows and columns represent individual nodes and their corresponding functional connectivity. BOLD, blood oxygenation level dependent; Cpu, caudate-putamen complex; M1, primary motor cortex; S1FL, primary somatosensory cortical forelimb area.

