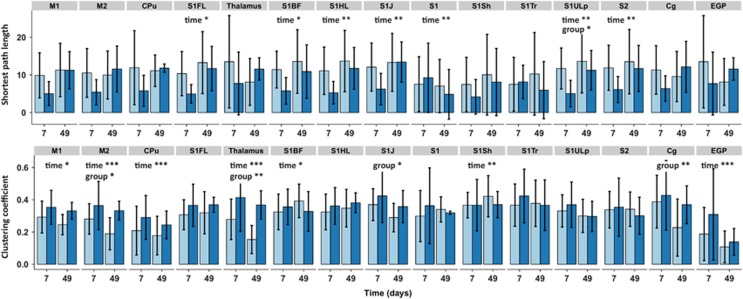
Figure 7.
Contralateral sensorimotor network features for individual local nodes. Weighted shortest path length and clustering coefficient values for individual network nodes are shown at the top and bottom, respectively. Statistical node × group and node × time output from the nested multilevel analysis are shown for significant nodes only. Bars represent group mean±s.d.; *P<0.05; **P<0.01; ***P<0.001, versus controls. Cpu, caudate-putamen complex; M1, primary motor cortex; S1FL, primary somatosensory cortical forelimb area.

