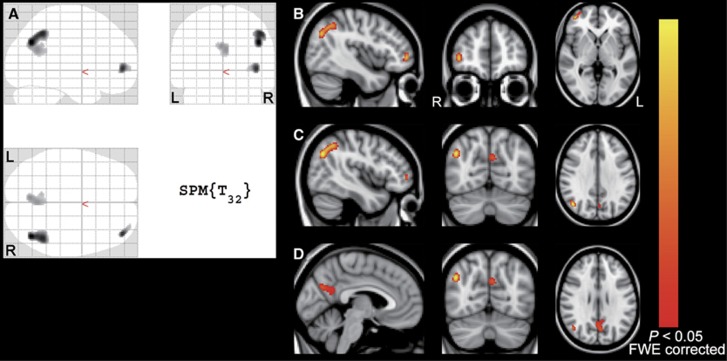
Figure 4.
Results of whole-brain voxel-wise analyses. Three significant clusters at P<0.05, FWE-corrected (T value>5.05) are displayed on SPM glass brain (A) and on MNI standard brain with MNI coordinates of each of the three peak-level voxels (B–D). MNI coordinates (x, y, z mm) for (B), (C), and (D) were (42, 50, 0), (44, −68, 32), and (−4, −68, 28), respectively. The yellow–red scale represents magnitude of P values. FWE, familywise error rate; L, left; R, right.

