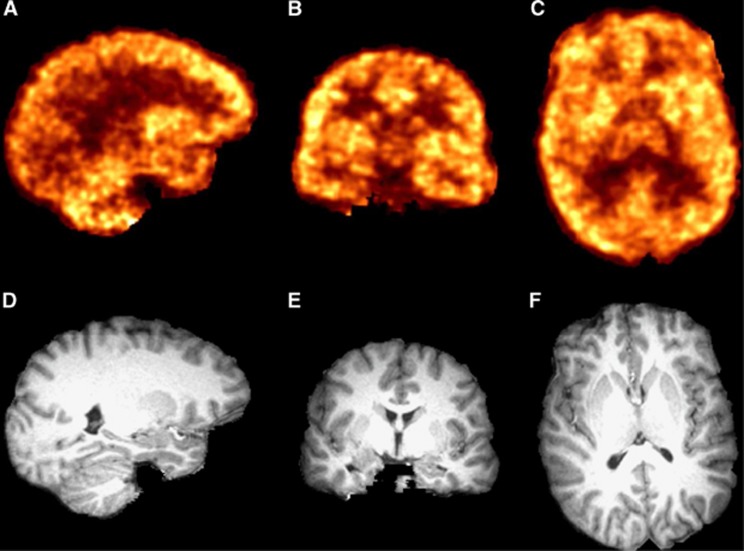
Figure 2.
Representative positron emission tomography (PET) images summed 40 to 60 minutes after injection of 680 MBq of [11C]OMAR (A–C) and subject's T1-weighted magnetic resonance (MR) images (D–F) shown in the same space as reconstructed PET data. Sagittal slices shown in A and D, coronal slices in B and E, and axial slices in C and F.

