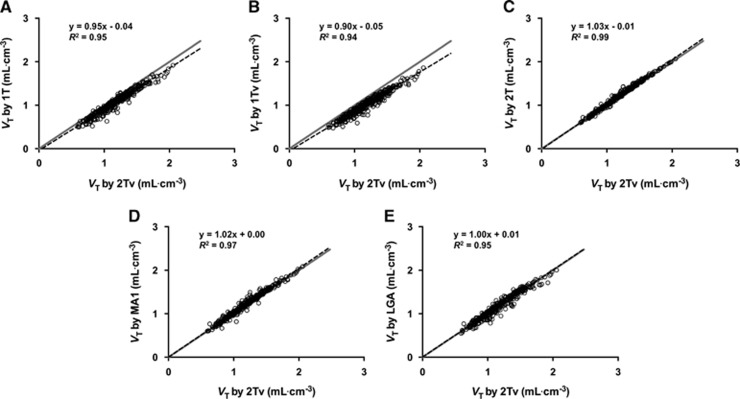
Figure 4.
Correlation of volume of distribution (VT) values estimated by alternative analysis methods against those obtained using the preferred compartmental model, 2TV. Dashed black lines show the linear regression line with the regression equation and correlation coefficient indicated on each panel. Solid gray lines designate the line of identity. Each marker represents the values estimated for a given region for a particular scan, with display of results from the 17 brain regions in each of 18 positron emission tomography (PET) scans.

