


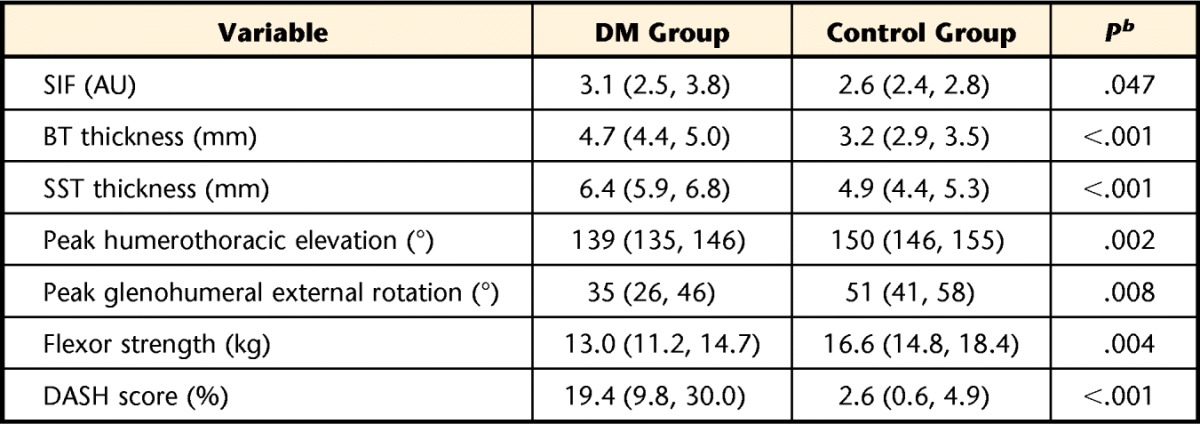
Table 2.
Differences in Metabolic, Structural, and Upper Extremity Movement and Function in Between Groupsa
a
All data presented as mean (95% confidence interval). DM group=participants with diabetes mellitus, control group=participants without diabetes mellitus, SIF=skin intrinsic fluorescence, AU=arbitrary units, BT=biceps tendon, SST=supraspinatus tendon, DASH=Disability of the Arm, Shoulder and Hand questionnaire.
b Significance determined using independent-sample Student t test (one tailed) to examine group differences (P<.05).