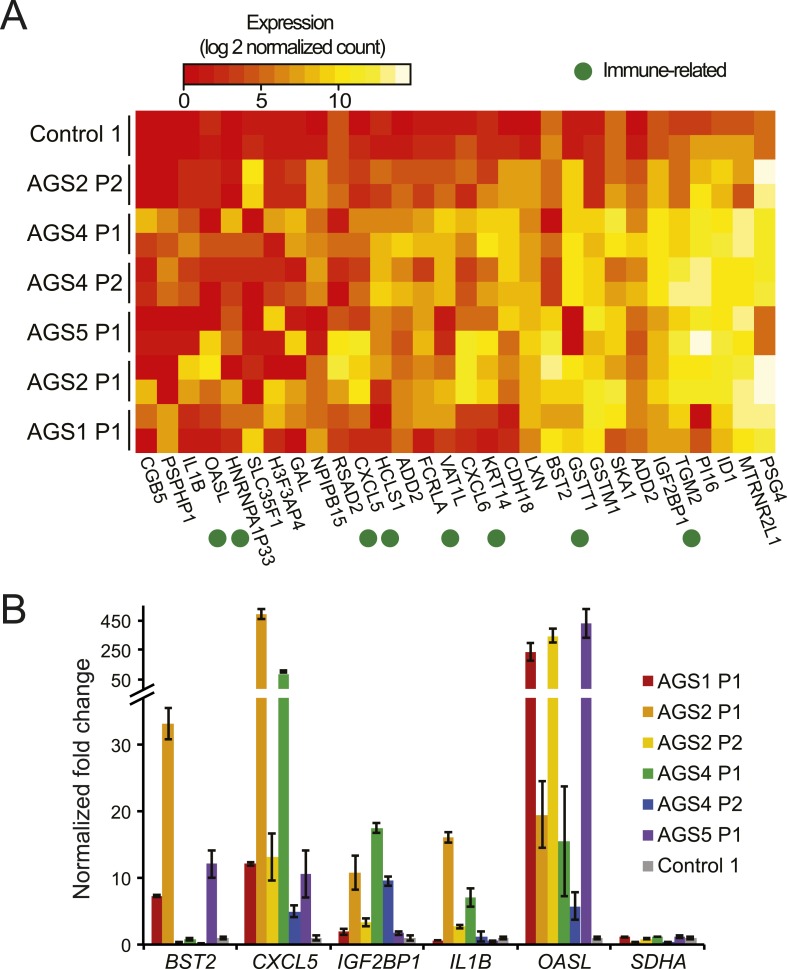
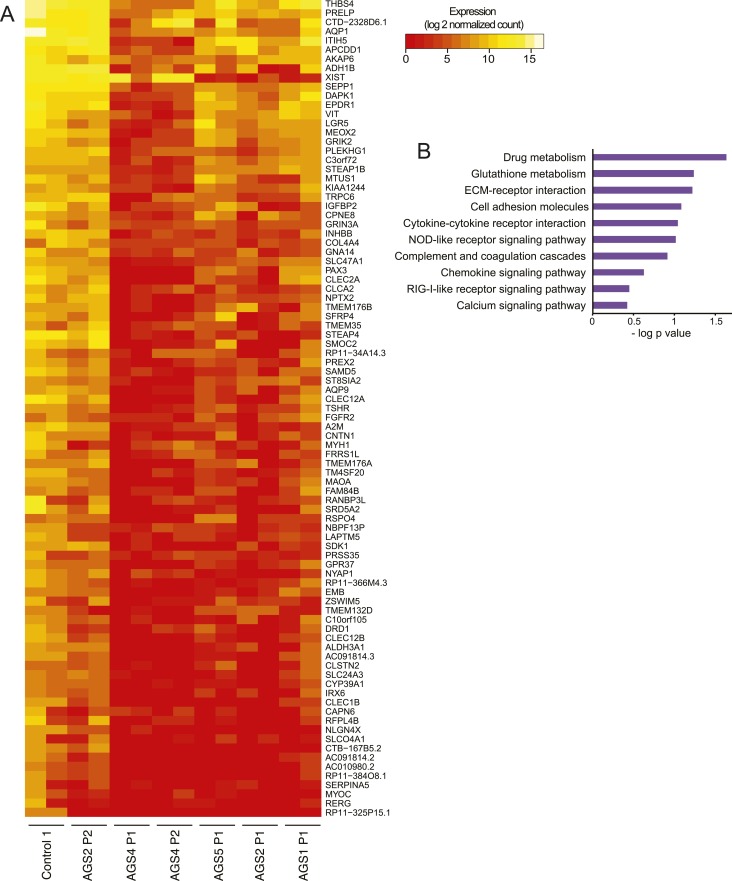
Figure 1. AGS fibroblasts exhibit activated immune antiviral response.
(A) RNA-seq heatmap showing log2 expression level of genes up-regulated in at least two Aicardi–Goutières syndrome (AGS) samples. Two biological replicates are shown for each sample. Immune-related genes are marked with green dots. (B) Gene expression changes between AGS samples and control were measured for five immune-related genes by real time reverse-transcription PCR (RT-qPCR). Y-axis represents fold change in gene expression, normalized to GAPDH gene, relative to the control sample. SDHA is another housekeeping gene used as control. Each value is the average of at least two technical replicates. Error bars represent SEM.


