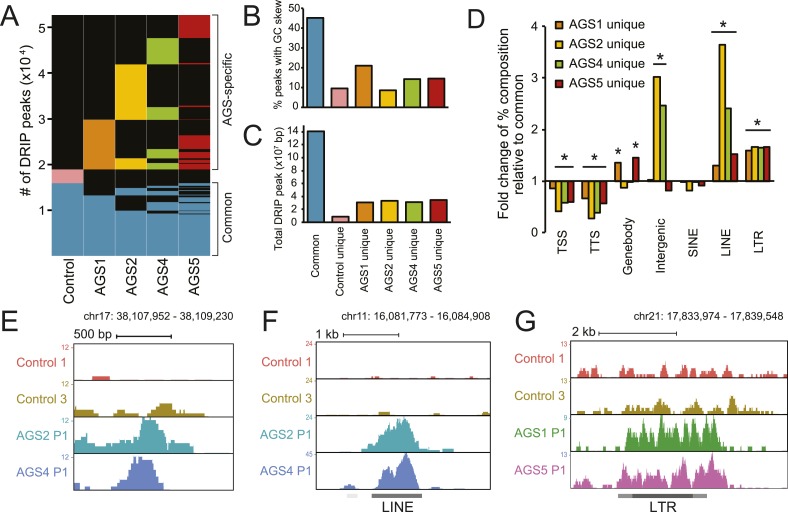
Figure 3. AGS fibroblasts accumulate RNA:DNA hybrids.
(A) All genomic loci overlapping with a DRIP peak in at least one sample are stacked vertically; the position of each peak in a stack is constant horizontally across samples. Each patient subtype or control occupies a vertical bar, as labeled. Each bar corresponds to merged data sets from two independent samples. Common peaks (i.e., form in control and at least one AGS sample) are represented in blue. Control-unique DRIP peaks are shown in pink; lack of DRIP signal over a given peak in any sample is shown as black. AGS-unique peaks are colored orange, yellow, green, and red in AGS1, 2, 4, and 5, respectively. Brackets on the right side demarcate common and AGS-specific peaks, respectively. (B, C) Graphs showing the % overlap between DRIP peaks and blocks of GC skew (B); and the total size of DRIP peaks in each category (C). Color codes are as described for (A). (D) Enrichment or depletion of AGS-unique DRIP peaks over different genomic features is shown relative to common DRIP peaks. * indicates p < 0.002 and fold change >20% relative to common peaks. (E–G) Representative examples of AGS-specific DRIP peaks over an intergenic region (E), a truncated long interspersed nuclear elements (LINE) element (F) and a truncated long terminal repeats (LTR) element (G).


