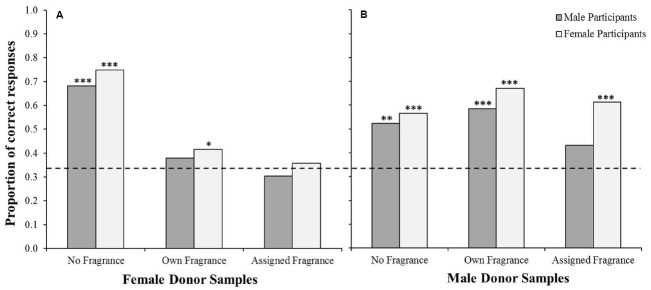
FIGURE 2.

Proportion of male and female participants who correctly chose the odd one out on the triangle test when using female samples (A) and male samples (B). Dashed line indicates the proportion of correct responses which would be expected by chance (0.33). Binomial tests indicated significance above chance *p < 0.05, **p < 0.01, ***p < 0.001.
