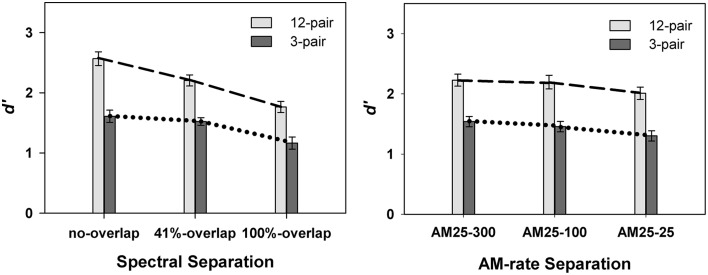
Figure 3.
Contrasts of mean d′-values in Experiment 1 between 12-pair and 3-pair stimulus sequences for the three spectral separations (left panel) and for the three AM-rate separations (right panel) (error bars represent ± one standard errors). Significance was found for the interaction of spectral separation X sequence duration, but not for the interaction of AM-rate separation X sequence duration.

