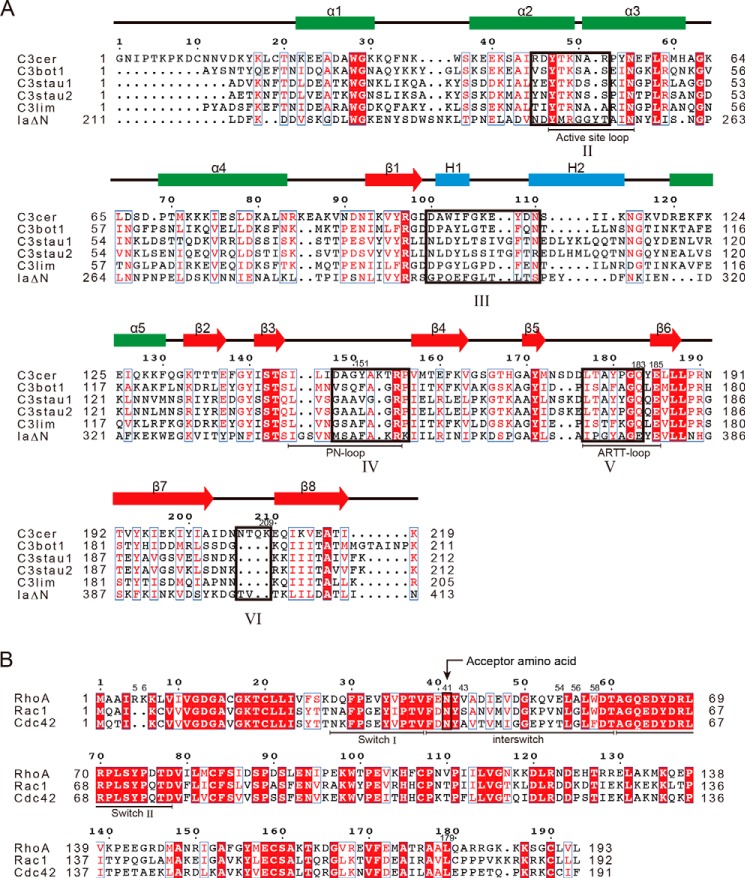
FIGURE 1.
Sequence alignments of C3 toxins and Rho GTPases. A, comparison of C3 toxins and IaΔN-(211–413). B, comparison of Rho GTPases. Secondary structures are shown over the alignments. H, 310-helix. The five interaction regions (II–VI) are outlined in black boxes. The structural features (loops and switches) are shown below the alignments. Alignments were carried out using T-Coffee.

