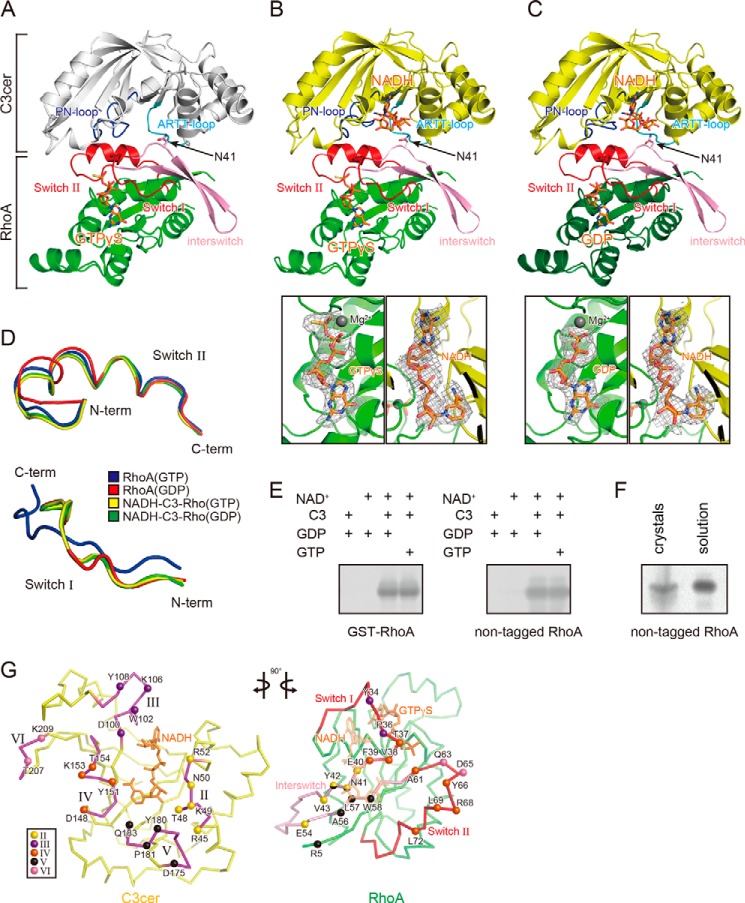
FIGURE 2.
Crystal structures of the C3cer-RhoA complex. A, overall structure of the apo-C3cer-RhoA. B, overall structure of the NADH-bound C3cer-RhoA(GTP) (upper panel) and electron density maps for GTPγS and NADH (lower panels). C, overall structure of the NADH-bound C3cer-RhoA(GDP) (upper panel) and electron density maps for GDP and NADH (lower two panels). The apo-form of C3cer is shown in white; the other forms are in yellow. In A–C, all RhoA are in green, and their switch regions and interswitch regions are in red and pink, respectively. Nucleotides (NADH, GTPγS, and GDP) are shown in stick form and colored orange. The ARTT loops and PN loops are in cyan and blue, respectively. The Fo − Fc simulated annealing omit maps are drawn at 1.0 σ, and the clipping distances are 30 Å. D, conformations of the main chains in the switch I (residues 28–38 (left panel)) and switch II (residues 61–78 (right panel)) regions of Rho: the GTP form (PDB code: 1A2B), GDP form (PDB code: 1FTN), NADH-bound C3cer-RhoA(GTP), and NADH-bound C3cer-RhoA(GDP) are colored blue, red, yellow, and green, respectively. E, ADP-ribosylation of GST-tagged and non-tagged of RhoA(GDP) and RhoA(GTP) by C3cer. F, ADP-ribosylation of crystal and solution of C3-RhoA(GTP). G, butterfly representation of the recognition residues in C3cer and RhoA. Roman numerals (II–VI) show the five binding regions in C3cer. In the left panel, the RhoA recognition residues in the five regions are shown as spheres. In the right panel, the C3cer recognition residues of RhoA are shown as spheres colored as in the left panel. The switch I and II regions are shown in red. In both panels NADH is shown in stick form and colored orange. The definitions of each region are provided in Fig. 1.

