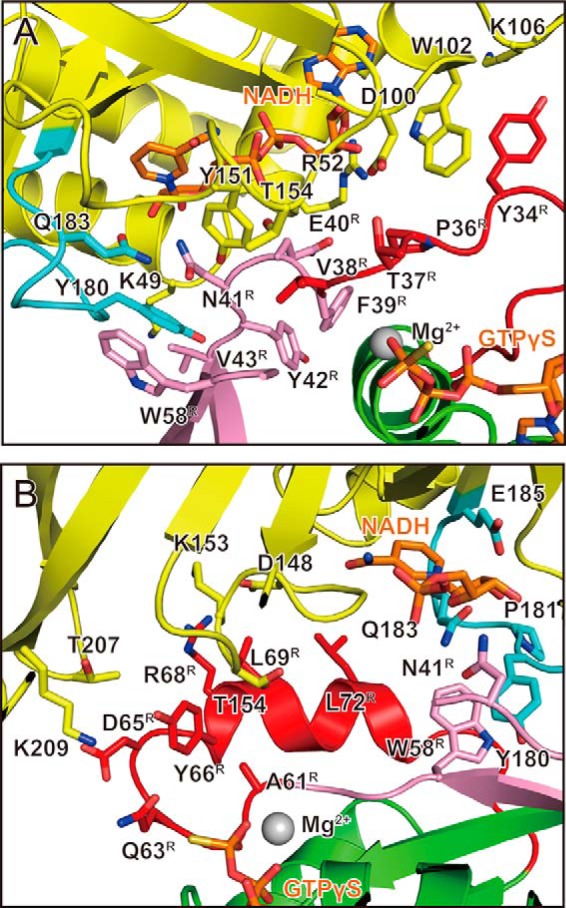
FIGURE 3.

Interactions around switch I and switch II in C3cer-RhoA(GTP) complex. This is a detailed view around switch I (A) and switch II (B). The residues involved in the interaction are labeled. C3cer, RhoA, the switch regions, and the interswitch region are colored yellow, green, red, and pink, respectively. The ARTT loops are shown in cyan (as in Fig. 2B).
