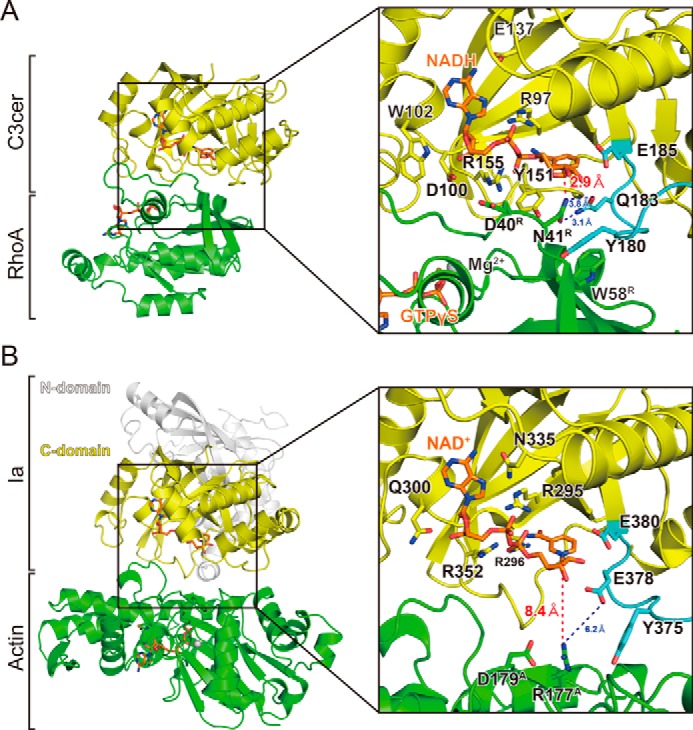
FIGURE 6.

Comparison of RhoA-specific and actin-specific ADP-ribosylating toxins. A, detailed view around the active site in C3cer. Components are colored as described in the legend for Fig. 2B. The distances between Asn-41 of RhoA and Gln-183 of C3cer and between Asn-41 of RhoA and the electrophile (NC1 of NAD(H)) are shown as dotted lines. B, detailed view around the active site in Ia (PDB code: 4H03). The Ia N terminus, Ia C terminus, actin, and NAD+ are shown in white, yellow, green, and orange, respectively. The residues needed for NAD(H) binding are also labeled. The distances between Arg-177 of actin and the electrophile (NC1 of NAD+) are shown as dotted lines.
