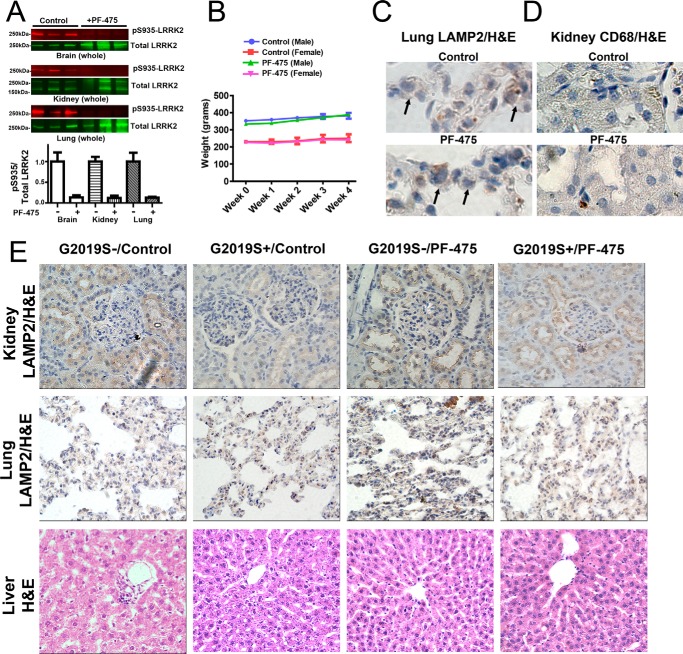
FIGURE 3.
LRRK2 kinase inhibition is well tolerated in rats. 10- to 12-week-old male Sprague-Dawley G2019S-LRRK2 BAC transgenic G2019S+ rats and non-transgenic G2019S− controls were treated at 30 mg·kg−1 b.i.d. by oral gavage with either PF-06447475 (PF-475) or control compound. A, tissues, including whole brain, kidney, and lung, were harvested from G2019S− rats treated with PF-06447475 or control 2 h post-oral gavage. Tissues were immediately processed into lysates for calculation of LRRK2 kinase inhibition (i.e. pS935/LRRK2 ratio) as determined by LI-COR analysis. n = 3 rats/group. B, weights from G2019S− rats were recorded at baseline and weekly, as indicated, with mean values shown calculated from at least 3 rats/group (error bars are mean ± S.E.). Weights from G2019S+ rat groups were not significantly different from G2019S− groups and, likewise, did not vary with treatment. C—E, after 4 weeks of drug treatment, at least three perfused rats from each of the four groups (G2019S− and G2019S+, as indicated) were processed into paraffin blocks, and sections from the liver, kidney, lung, and spleen were stained with H&E, Masson's trichrome, LAMP2-DAB, CD68-DAB, and Oil Red O (for lipids, lipofuscin, and lipoproteins). Sections were evaluated by a pathologist blinded to group identity, and all images are representative of sections derived from the 3 rats/group. C, representative high-magnification (×63) images of lung tissue highlighting type II pneumocytes (arrows) stained with an antibody for LAMP2 (brown coloration, DAB stain) with H&E as a contrast stain. D, representative high-magnification (×40) images of kidney renal tubules stained for CD68 to highlight myeloid cells (brown coloration, DAB-stain) with H&E as a contrast stain. E, representative low-magnification (×20) images of the indicated organ with the indicated stain. In all animals and stains, no differences could be detected between the groups.

