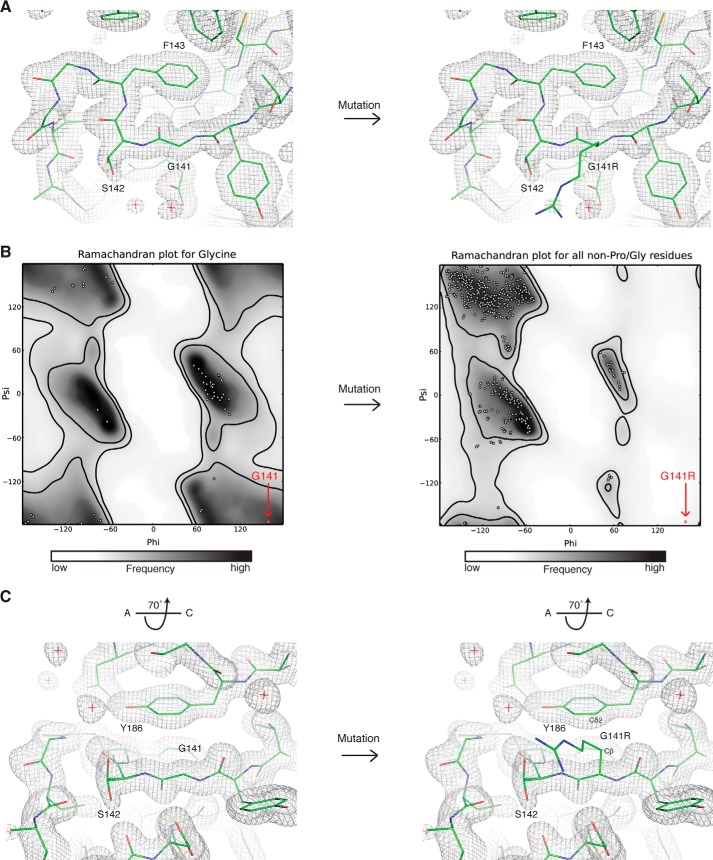
FIGURE 5.
Detailed view of the position of glycine 141, which reveals steric restraints on the identity of this residue. A, view of main chain topology up- and downstream of glycine 141. The protein chain (green sticks) is shown for glycine 141 (left) or the G141R mutation (right) modeled as the most sterically permissive rotamer (fewest clashes). The final 2Fo − Fc electron density map is represented as a gray mesh. B, Ramachandran plots for glycine (left) or non-proline/glycine residues such as arginine (right). White dots show the distribution of φ and ψ angles for residues in the HsBBS91–407 structure. The position of glycine 141 and the G141R point mutant is shown (red dot). Favored regions (inner black line) and allowed regions (outer black line) are shown, and the plot is colored from white to black according to frequency of occurrence in the Top500 database of high-resolution protein structures. These plots were generated in PHENIX (18). C, view of the G141R-Tyr186 steric clash, rotated by 70° around the x axis relative to A. The arginine side chain is pointing out of the page. The atoms in close contact are labeled.

