
FIGURE 7.
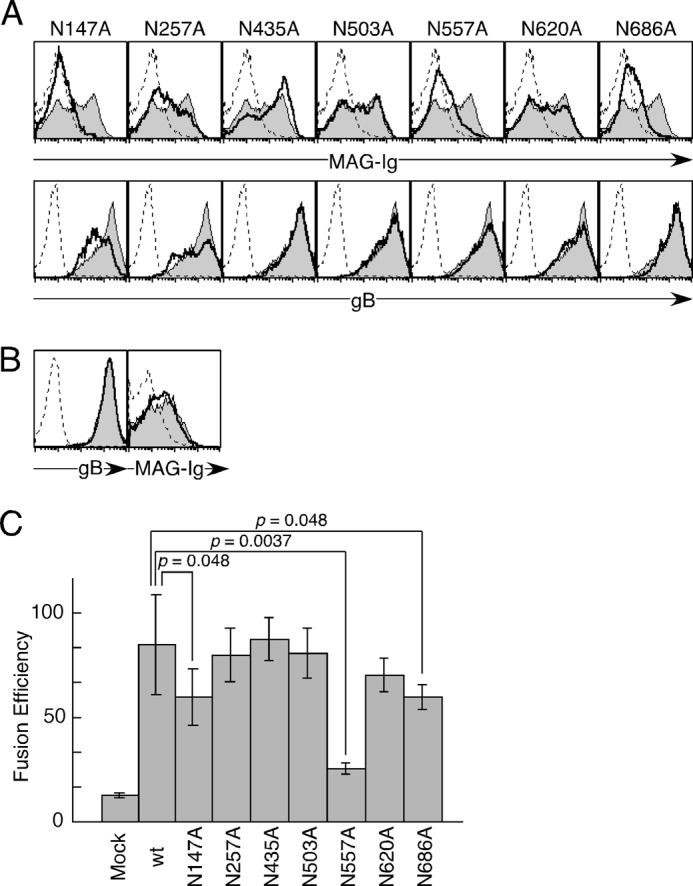
The involvement of several Asn residues of gB in cell-cell fusion. A, mock-transfected (dotted line), WT-gB-transfected (gray area), or mutated gB-transfected (bold line) 293T cells were stained with MAG-Ig (top panels) and anti-gB mAb (bottom panels), followed by flow cytometry analysis. B, mock-transfected (dotted line), WT-gB-GPI-transfected (gray area), or gB (N147A)-GPI-transfected (bold line) 293T cells were stained with anti-gB mAb (left panel) or MAG-Ig (right panel), followed by flow cytometry analysis. C, WT-gB or mutated gB in which putative N-glycosylation sites were mutated was cotransfected into 293T effector cells with gH and gL. The effector cells were cocultured with other 293T target cells transfected with MAG, followed by luminescence measurements. The relative fusion efficiencies are shown on the basis of representative data from three independent experiments. The error bars represent the mean ± S.D. on the basis of six replicate samples. Statistical differences were determined using Student's t test. Each mutated gB without a p value did not differ significantly compared with wild-type gB (WT). p < 0.05 was considered significant.