
FIGURE 8.
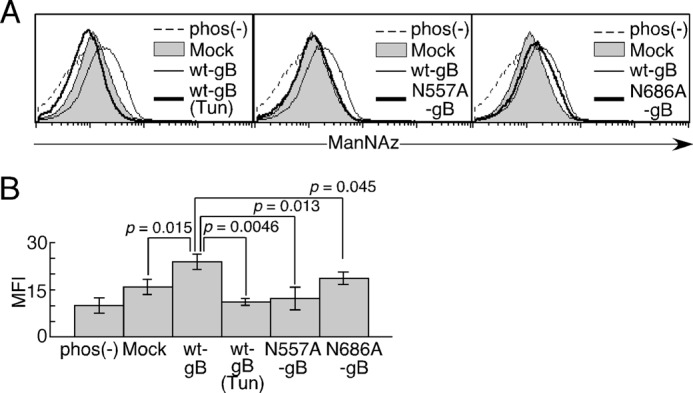
The sialylation of Asn-557 and Asn-686 in gB. A, 293T cell transfectants were labeled with ManNAz. The relative cell numbers are shown for mock transfectants (gray area), WT gB transfectants (thin line), mutated gB transfectants, and WT gB transfectants treated with tunicamycin (Tun) (bold line). gB transfectants labeled with ManNAz but not incubated with phosphine-biotin were stained with SA-allophycocyanin (dotted line). B, the mean fluorescence intensity (MFI) of each cell is shown. The error bars represent the mean ± S.D. on the basis of triplicate samples. Statistical differences were determined using Student's t test. p < 0.05 was considered significant. Representative data from three independent experiments are shown.