FIGURE 1.
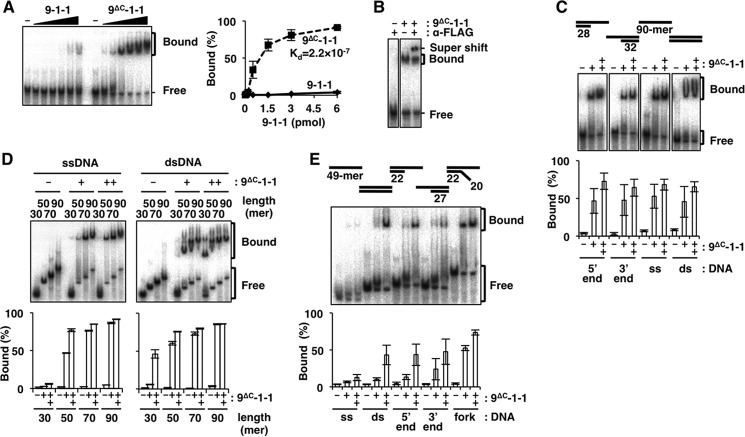
DNA binding of 9ΔC-1-1 analyzed by EMSA. Autoradiographs of EMSA with 9-1-1 or 9ΔC-1-1 under various conditions are shown. A, increasing amounts of 9-1-1 or 9ΔC-1-1 (0, 0.06, 0.17, 0.5, 1.5, 3, and 6 pmol each) were incubated with 5′ end DNA. B, 9ΔC-1-1 (2 pmol) was incubated with 5′ end DNA, with or without 250 ng of anti-FLAG monoclonal antibody. A super-shifted band appeared in the presence of the antibody. C, 9ΔC-1-1 (0, 0.75, or 1.5 pmol) was incubated with the 5′ end, 3′ end, ssDNA, and dsDNA. D, 9ΔC-1-1 (0, 1.5, or 3 pmol) was incubated with ssDNA or dsDNA with lengths ranging from 30- to 90-mer. E, 9ΔC-1-1 (0, 2.5, and 5 pmol) was incubated with various 49-mer DNAs (ss, ds, 5′ end, 3′ end, and fork). It should be noted that differences among experiments in DNA-binding efficiencies were the result of different specific activities of 9ΔC-1-1 preparations. Intensities of the shifted bands in A, C, D, and E were quantified, and their ratios (%) relative to total DNA are graphed on the right side or below. Values represent the means of three independent experiments, and error bars indicate S.E. A, inset is Kd of 9ΔC-1-1, which was estimated as 2.2 × 10⁻⁷ from the quantified shifted bands, although the values of the shifted bands of 9-1-1 were too low to estimate the precise Kd value from this study.

