FIGURE 4.
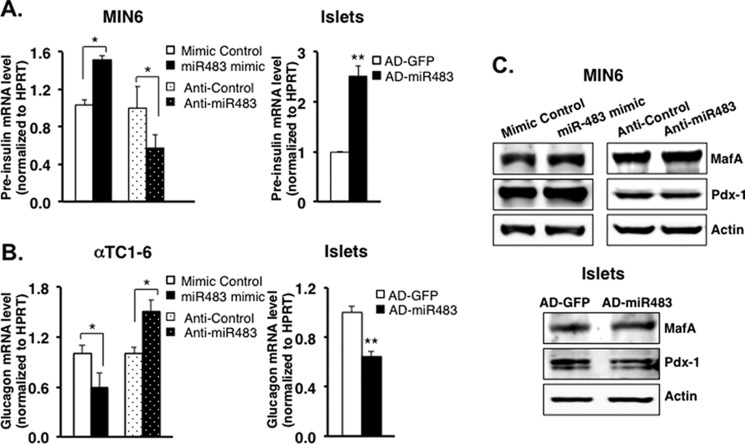
miR-483 promotes insulin transcription while repressing glucagon transcription. A, MIN6 were transfected with miR-483 mimic or anti-miR483, or isolated islets were infected with AD-miR483. After 48 h, transfected cells were incubated with 25 mm glucose in DMEM (for MIN6) or 16.7 mm glucose (for islets) for 16 h, and total RNA was extracted to analyze the expression of pre-insulin by real-time PCR. B, 48 h after miR-483 mimic transfection in αTC1-6 or AD-miR483 in isolated islets, transfected cells were incubated with 1 mm glucose in DMEM (for αTC1-6) or 2.7 mm glucose (for islets) for 16 h, and total RNA was extracted to analyze the expression of glucagon by real-time PCR. The data were normalized to internal control HPRT, and the results are the average of three independent experiments ± S.D.; **, p < 0.01 versus mimic control. C, the expression of MafA, Pdx-1, and actin was analyzed by Western blot in transfected MIN6 and islets. Results are representative of three independent experiments.

