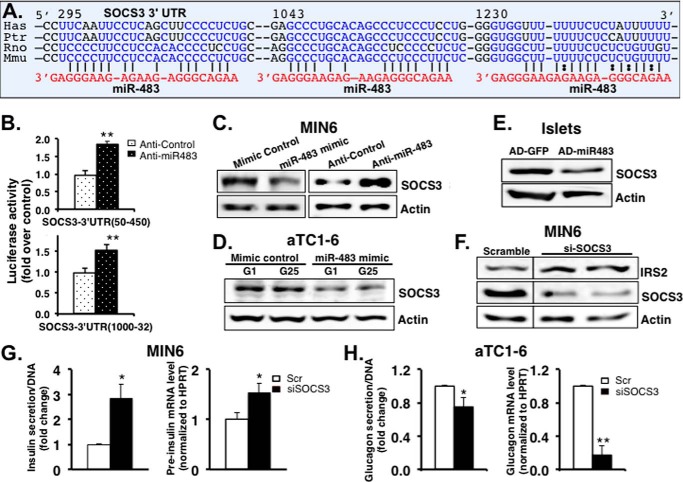
FIGURE 5.
SOCS3 is one of the targets of miR-483 in pancreatic β-cells. A, bioinformatic prediction of the interaction between miR-483 and the 3′-UTRs of SOCS3 of various species. Has, Ptr, Rno, and Mmu represent human, chimpanzee, rat, and mouse, respectively. The predicted three binding sites are indicated in blue. B, luciferase assay confirmed that miR-483 inhibited the luciferase reporter activity, in which the SOCS3 3′-UTR fragments (50–450 and 1000–1320 bp) were fused with a Renilla luciferase reporter gene in pRLTK, respectively. The reporter constructs were co-transfected into MIN6 cells with either anti-miR483 or anti-control. The pGL3 firefly luciferase plasmid was co-transfected for detection of transfection efficiency. 48 h after transfection, luciferase activity was assayed using the Dual-Luciferase reporter assay kit. Data represent means ± S.E. of three independent experiments. **, p < 0.01. C–E, overexpression of miR-483 down-regulates SOCS3 protein expression in MIN6 (C), αTC1-6 (D), and isolated islets (E) validated by Western blots. Data are representative of three independent experiments. F, silencing of SOCS3 activated the expression of IRS2. 48 h after transfection with siRNA against SOCS3 (#1 and #2) or Scramble (Scr) in MIN6 cells, cell lysates were prepared for Western blots to detect the expression of IRS2, SOCS3, and actin. Results are representative of three independent experiments. G, silencing of SOCS3 increased insulin secretion and insulin transcription. H, silencing of SOCS3 reduced glucagon secretion and transcription. Secreted insulin and glucagon levels in the medium were quantified using mouse insulin or glucagon ELISA and normalized to total cellular DNA contents. Total RNA was extracted to analyze the expression of insulin or glucagon by real-time PCR. The data were normalized to internal control HPRT. The presented data are the average of three independent experiments ± S.D. *, p < 0.05, **, p < 0.01.

