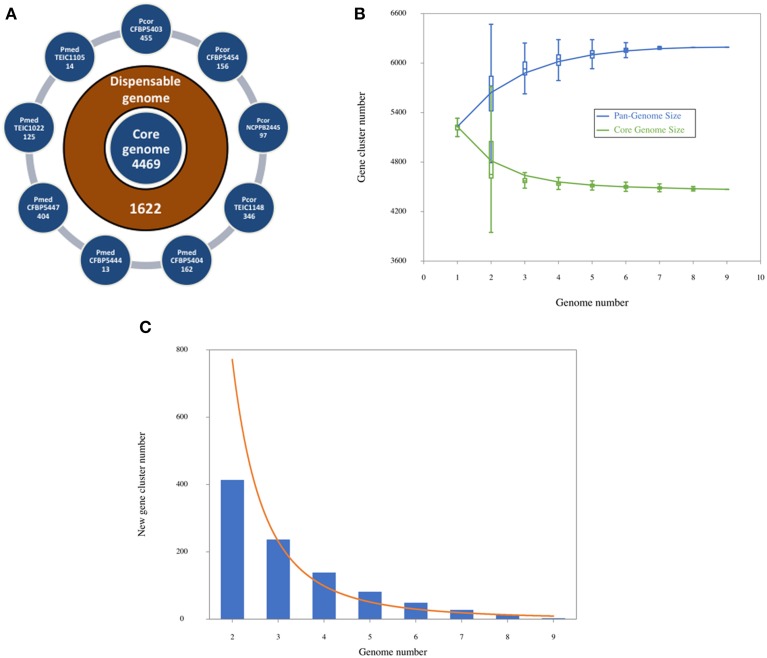
Figure 3.
(A) Numbers of shared and specific genes between Pseudomonas corrugata and P. mediterranea based on clusters. External circles show singletons of each genome. The intermediate circle shows the number of dispensable genes, and the inner one shows the core genome size, given by the number of clusters with at least one gene of each genome. (B) Core-genome and pan-genome sizes according to the number of genomes considered in the dataset. For each k in X axis, all possible combinations of k genomes (among 9 of this study) are taken and, for each one of these combinations, pan and core numbers are plotted. (C) Number of new genes observed upon adding a new genome at each step in the dataset.

