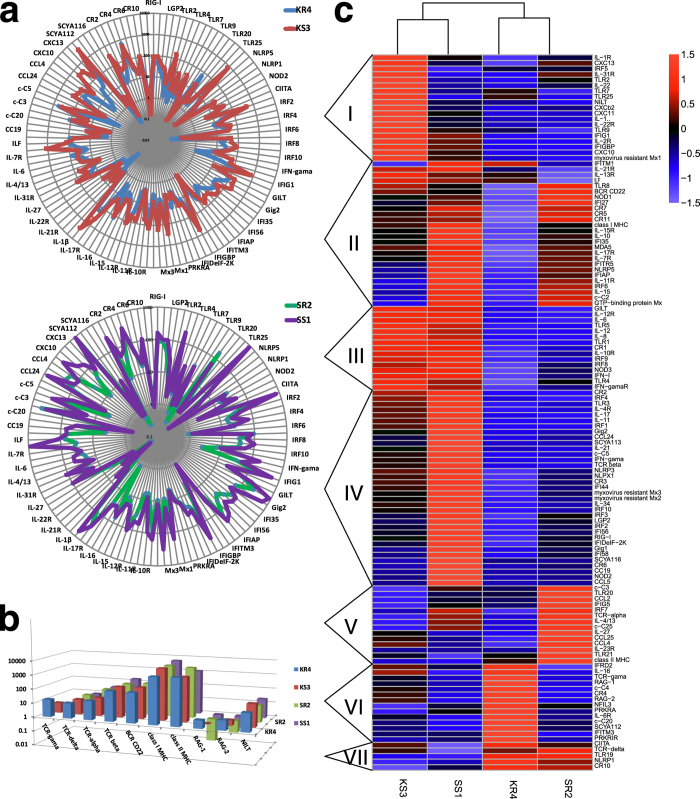
Figure 3. Changes in expression of immune-related genes upon GCRV infection.
(a) Expression comparison of innate immune-related genes between susceptible and resistant libraries in head-kidney and spleen. The periphery of the circle is the X axis which presents genes; while the radius of the circle is the Y axis which presents the FPKM value of corresponding gene. The closer from the edge of the circle, the higher the expression of corresponding gene is. In this case, mostly innate immunity-related genes are relatively lowly expressed in resistant libraries. (b) Expression comparison of adaptive immune-related genes in head-kidney and spleen. Mostly genes are slightly higher-expressed in resistant libraries, comparing to susceptible libraries. (c) Two-dimensional hierarchical clustering performed on the clusters of immune-related genes which can be classified into 7 clusters named I–VII.

