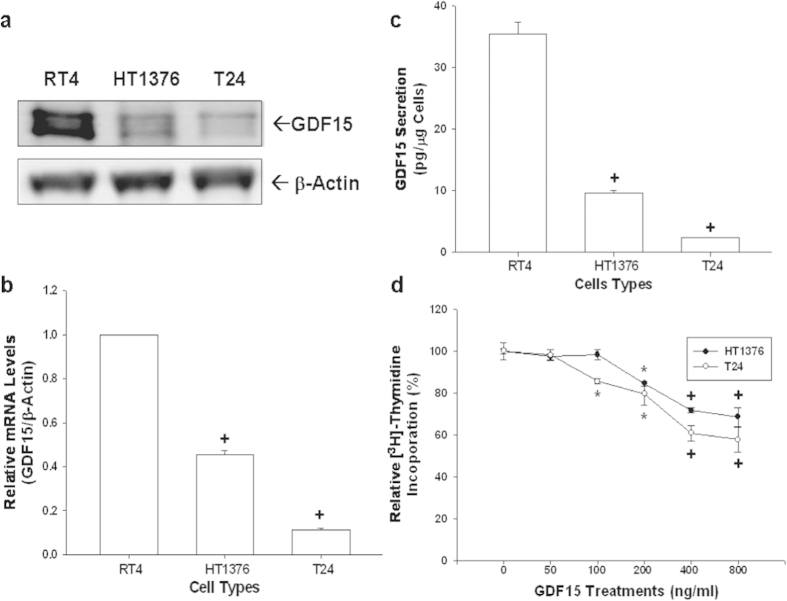
Figure 1. Gene expressions of GDF15 in human bladder carcinoma cells and the effect of GDF15 on cell proliferation.
All bladder cells used in this study were serum starved for 24 hours subsequently incubated in RPMI media containing 10% FCS for another 24 hours. (a) Cell proteins were then lysed for immunoblotting assay. (b) Total RNA was extracted from cells for the RT-qPCR assay. Data are presented as mean-fold (±S.E.; n = 3) in relation to that of the RT4 cell group. (c) Conditioned media was collected for ELISA in order to determine the level of GDF15 secretion in the various bladder carcinoma cells. Data is presented as the mean (±S.E.; n = 6) of the GDF15 levels. (d) Proliferation rates in HT1376 (black circle) and T24 (white circle) cells treated with various concentrations of GDF15 were determined by 3H-thymidine incorporation assays. Each point on the curve represents the mean-percentage (±S.E.; n = 6) relative to solvent-treated group (*P < 0.05, +P < 0.01).

