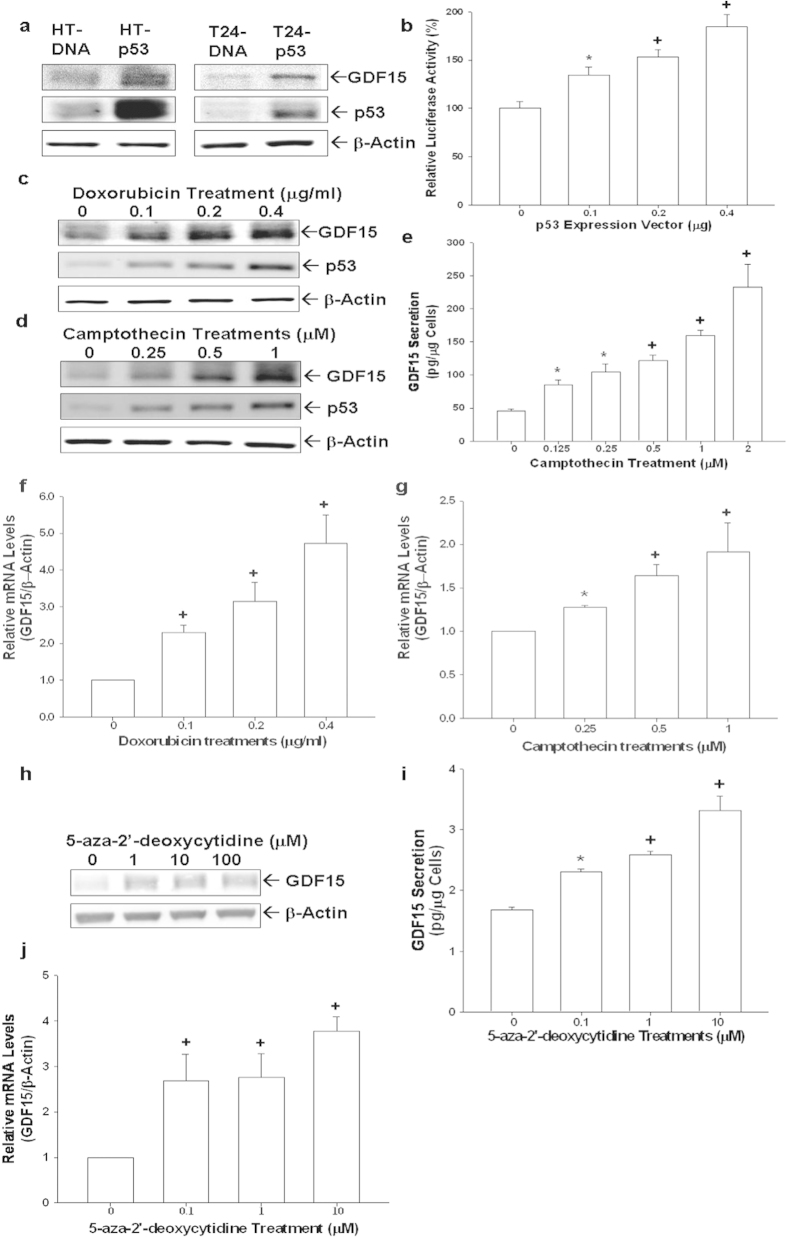
Figure 2. Modulation of p53 and demethylation on GDF15 expression in human bladder carcinoma cells.
(a) HT1376 (left) and T24 (right) cells were transiently overexpressed with p53 for 72 hours. The levels of GDF15 and p53 expressions were determined by immunoblotting assays. (b) The GDF15 report vector was co-transfected with various concentrations of p53 expression vector into HT1376 cells for 72 hours. Data are expressed as the mean percentage ± S.E. (n = 6) of luciferase activity relative to mock-transfected groups. Expressions of GDF15 and p53 in RT4 cells following doxorubicin (c) or camptothecin (d) treatments were determined by immunoblotting assays. (e) GDF15 secretion in RT4 cells following camptothecin treatments was determined by ELISA. Data are expressed as mean (±S.E.; n = 6) of the GDF15 levels. Total RNAs were extracted from doxorubicin treated (f) and camptothecin treated RT4 (g) cells for RT-qPCR assays. T24 cells were treated with various concentrations of 5-Aza-2′-deoxycytidine for 48 hours and then GDF15 expression was determined by immunoblotting (h), ELISA (i), and RT-qPCR assays (j). Data are expressed as the mean-fold ± S.E. (n = 3) relative to solvent-treated groups and mean (±S.E.; n = 6) of the GDF15 levels. (*P < 0.05, +P < 0.01).

