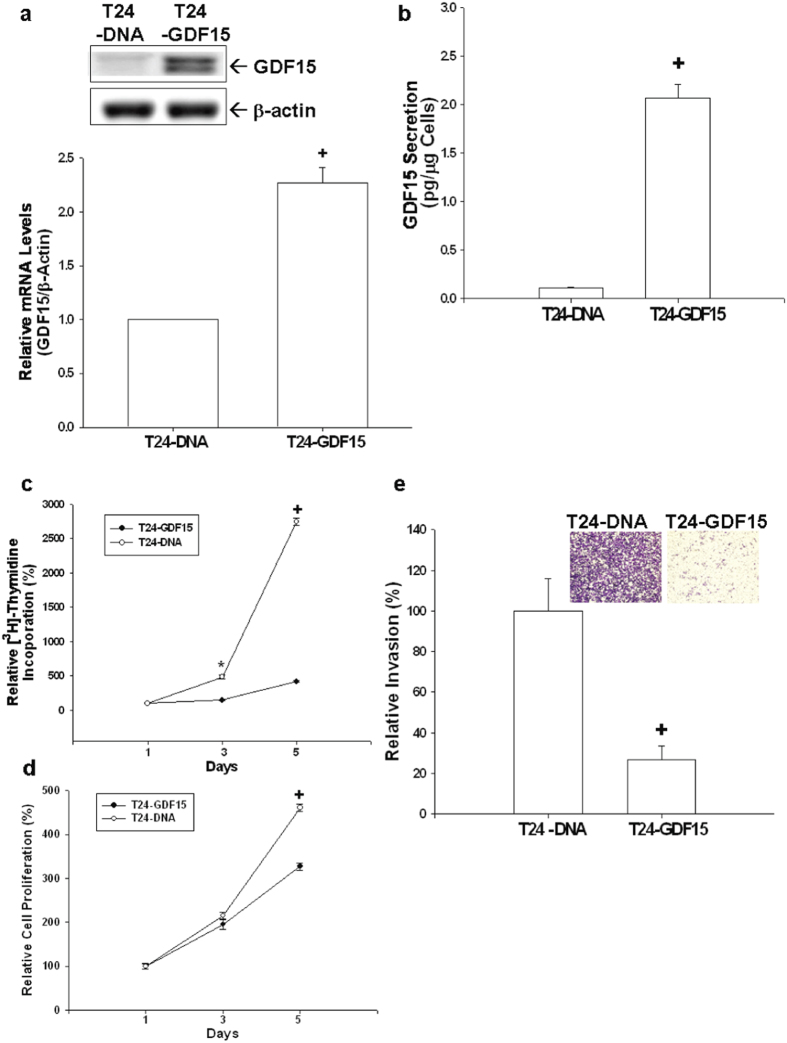
Figure 5. Effects of GDF15 overexpressed on cell proliferation and invasion in T24 cells.
Expressions of GDF15 in T24 cells transfected with pcDNA3 (T24-DNA) or pcDNA-GDF15 (T24-GDF15) expression vector were determined by immunoblotting assays (a, top), RT-qPCR assays (a, bottom) and ELISA (b). Data are expressed as mean-fold (±S.E.; n = 3) in relation to the T24-DNA cell group and the mean (±S.E.; n = 6) of the GDF15 levels. Cell proliferations in T24-DNA (white circle) and T24-GDF15 (black circle) were determined according to 3H-thymidine incorporation (c) and MTS assays (d). Each point on the curve represents the mean-percentage (±S.E.; n = 6) of that on day 1. (e) The invasive ability of cells was determined by the in vitro matrigel invasion assays. Data are presented as the mean-percentage (±S.E.) in relation to that of the T24-DNA cell group. (*P < 0.05, +P < 0.01).

