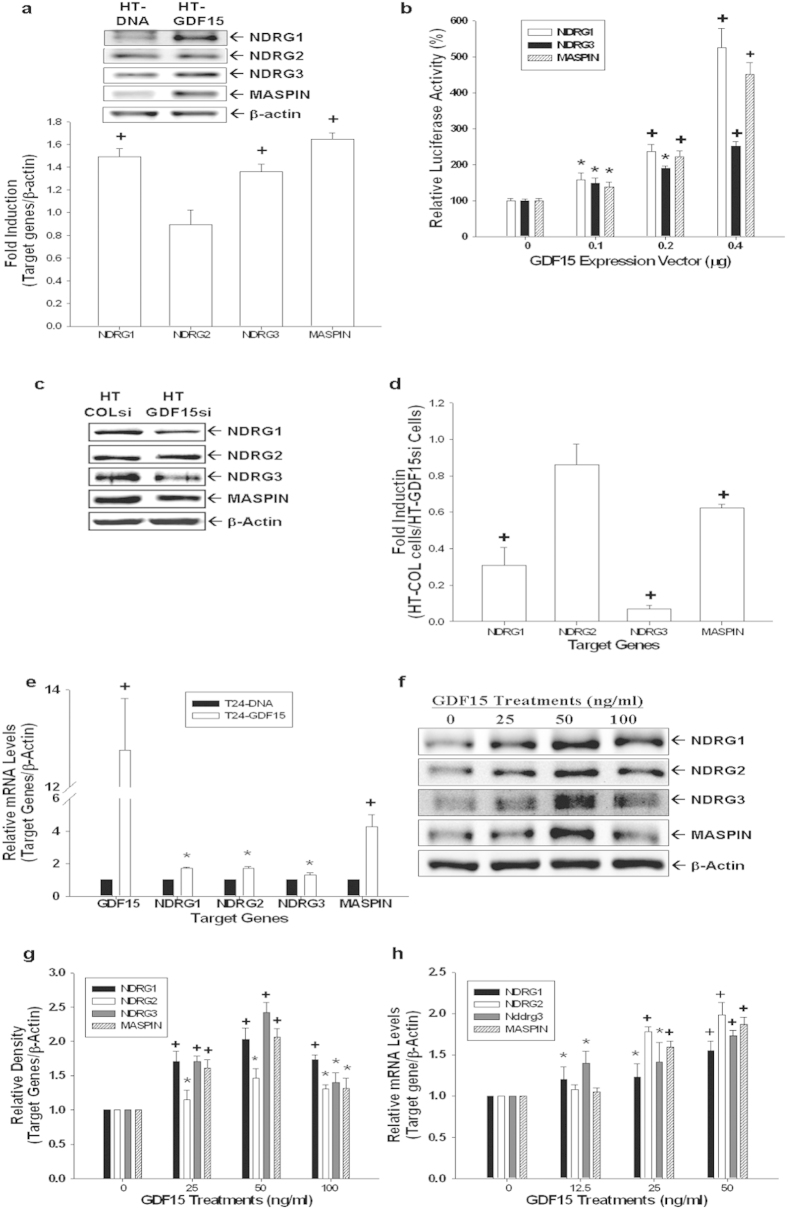
Figure 6. Modulation of GDF15 on the expressions of MASPIN, NDRG1, NDRG2, and NDRG3 genes in bladder carcinoma cells.
(a) Differences in expressions of NDRG1, NDRG2, NDRG3, and MASPIN between HT-DNA and HT-GDF15 cells were determined by immunoblotting assays. Data of quantitative analysis are expressed as the intensity of the protein bands produced from the target gene/β-actin (±S.E.; n = 3) of HT-GDF15 cells relative to that of the HT-DNA group. (b) The reporter vectors of NDRG1, NDRG3, and MASPIN were cotransfected with various concentrations of GDF15 expression vectors into HT1376 cells for 72 hours. Data are expressed as the mean percentage ± S.E. (n = 6) relative to the mock-transfected groups. Expressions of GDF15, NDRG1, NDRG2, NDRG3, and MASPIN in mock-knockdown HT1376 (HT-COLsi) and GDF15-knockdwon HT1376 (HT-GDF15si) cells were determined by immunoblotting (c) and RT-qPCR (d) assays. Data are presented as mean-fold (±S.E.) in relation to the HT-COLsi cell group. (e) Differences in the expressions of GDF15, NDRG1, NDRG2, NDRG3, and MASPIN genes between T24-DNA and T24-GDF15 cells were determined by RT-qPCR assays. Data are presented as mean-fold (±S.E.) in relation to the T24-DNA cell group. Differences in the expressions of NDRG1, NDRG2, NDRG3, and MASPIN genes following treatments with various concentrations of rhGDF15 were determined by immunoblotting (f) and RT-qPCR (h) assays. Data of quantitative analysis are expressed as the intensity of the protein bands produced from the target gene/β-actin (±S.E.; n = 3) relative to that of the solvent-control group (g). (*P < 0.05, +P < 0.01).

