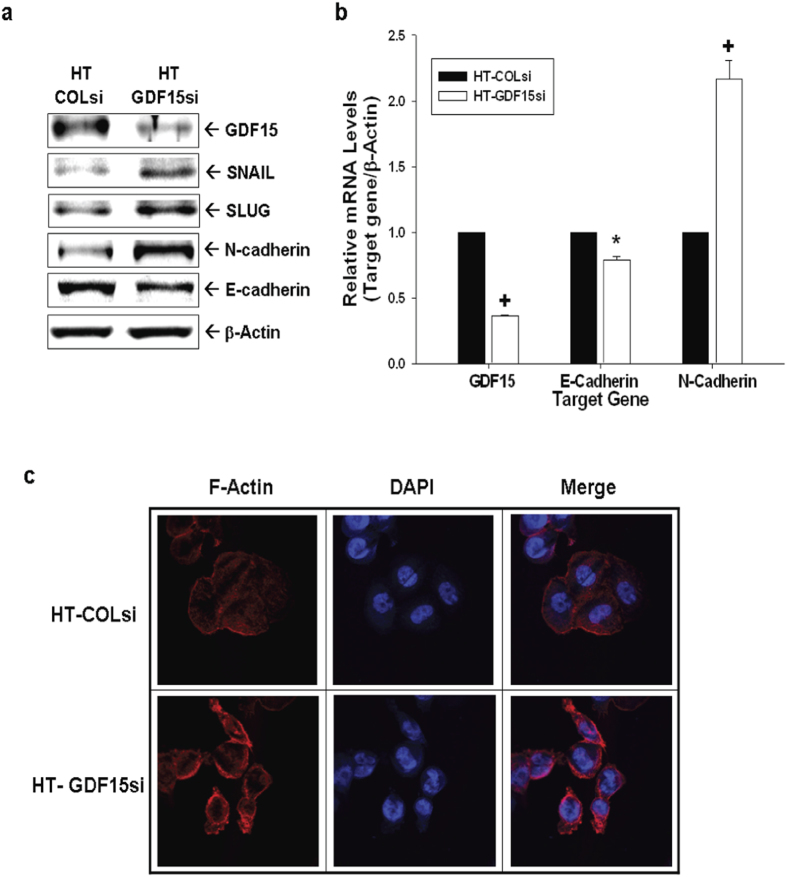
Figure 7. Expression of GDF15 modulates the expression of epithelial-mesenchymal transition markers in human HT1376 cells.
(a) Expression levels of SNAIL, SLUG, E-cadherin, and N-cadherin in HT-GDF15si and HT-COLsi cells were determined by immunoblotting assays. (b) Expressions of GDF15, E-cadherin, and N-cadherin in HT-GDF15si (white bars) and HT-COLsi (black bars) cells were determined by RT-qPCR assays. Data are presented as mean-fold (±S.E.) in relation to the HT-COLsi cell group. (c) Distribution of F-actin (red) between HT-GDF15si and HT-COLsi cells was determined by immunofluorescence staining. DAPI (blue) was applied to stain the nucleus. (*P < 0.05, +P < 0.01).

