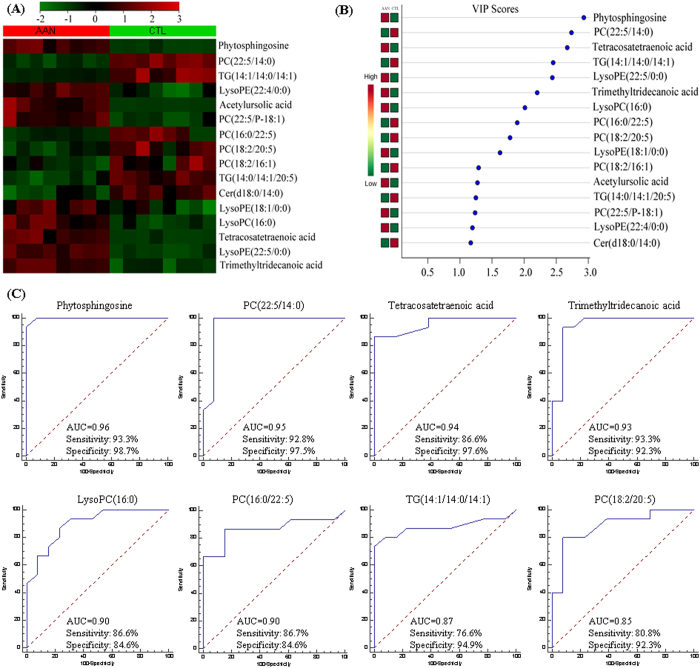
Figure 5. Hierarchical cluster analysis and ROC curves of 16 identified metabolites from AAN and control group in the 8th week.
(A) Clustered heat map of only 16 (only appeared at 8 week or after 8 week) out of 69 identified metabolites between 8th week AAN and control groups after observable histological kidney damage and conventional clinical chemistry indications of nephrotoxicity. Heatmap displays of the most significantly changes from 16 metabolites. The colour of each section is proportional to the significance of alternation of metabolites in kidney tissue. Green indicates reduction, red indicates increase compared to control group. Columns represent individual experiments and rows represent each identified metabolites from AAN and control groups in the 8th week. (B) VIP scores with expression heat map from PLS-DA analysis. PLS-DA analysis was constructed with signature metabolites from AAN and control rats. Red and green indicated increased and decreased levels, respectively. (C) PLS-DA based ROC curves of 8 out of 16 identified metabolites for evaluation of AAN with the individual biomarkers. The associated AUC, sensitivity and specificity values were indicated.

