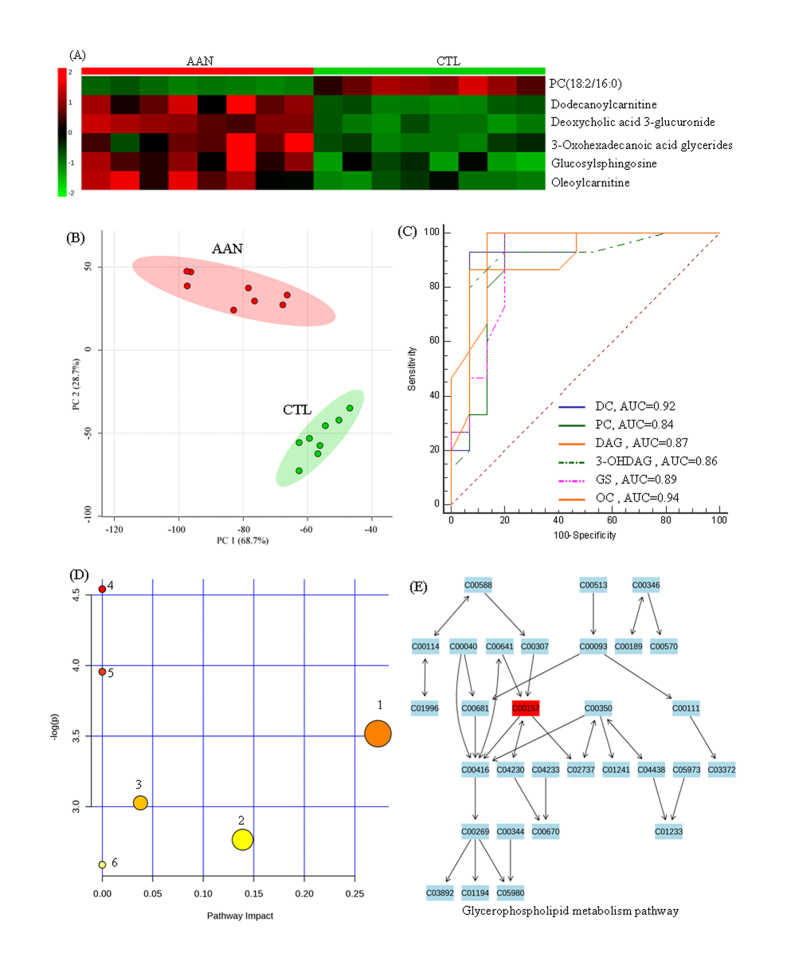
Figure 6. Hierarchical cluster analysis, ROC curves and metabolic pathway of metabolites in advanced nephrotoxicity (24th week).
(A) Clustered heat map of seven metabolites only appeared at week 24. These identified metabolites showed a response on advanced nephrotoxicity in kidney tissue. (B) Principal component analysis shows separation of AAN group (red) and control group (green). PC1 versus PC2 were shown distribution of grouped individuals. The AAN and control groups could be separated completely based on seven identified metabolites. (C) PLS-DA-based ROC curves for the individual metabolites with high sensitivity and specificity from six metabolites. (D) Summary of pathway analysis with Ingenuity Pathway Analysis based on KEGG database. All the matched pathways were presented as circles. The color and size of each circle was based on p-value and pathway impact value, respectively. (1) linoleic acid metabolism; (2) alpha-linolenic acid metabolism; (3) pentose and glucuronate interconversions; (4) starch and sucrose metabolism; (5) glycerophospholipid metabolism; (6) arachidonic acid metabolism. (E) Pathway of glycerophospholipid metabolism with Ingenuity Pathway Analysis based on KEGG database. Compound numbers were consistent with KEGG database. DC, dodecanoylcarnitine; PC, PC(18:2/16:0); DAG, deoxycholic acid 3-glucuronide; 3-OHDAG, 3-oxohexadecanoic acid glycerides; GS, glucosylsphingosine; OC, oleoylcarnitine.

