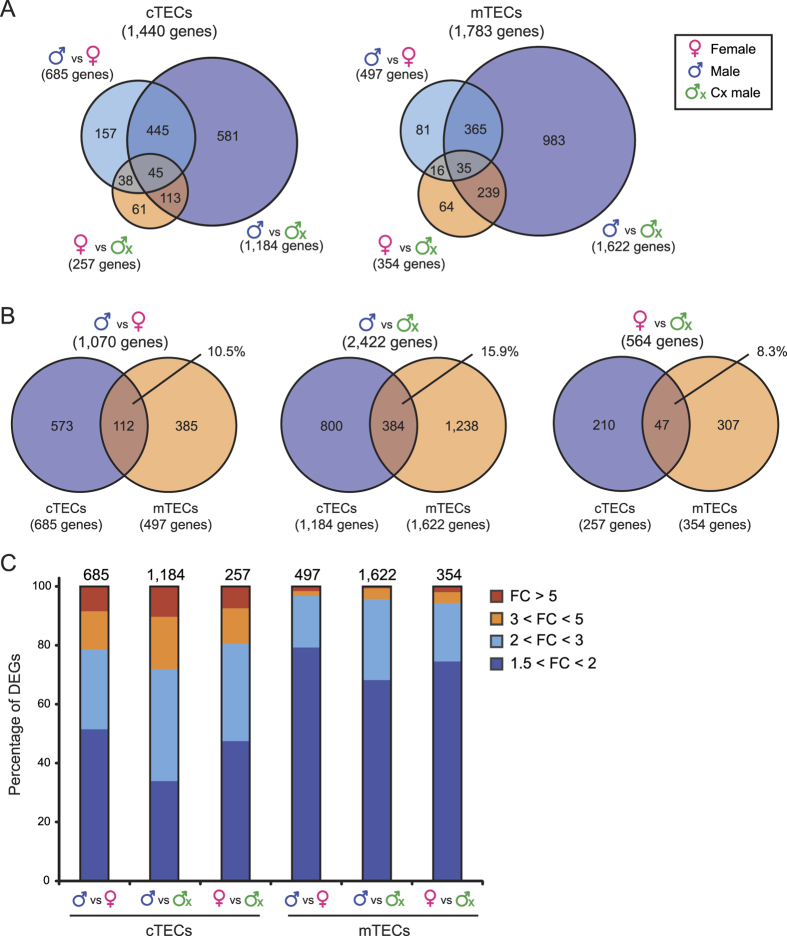
Figure 2. Transcriptomic signatures of cTECs and mTECs in 6 month-old male, female and Cx male mice.
(a) Venn diagram representation of DEGs in cTECs and mTECs from the three experimental groups. (b) Overlap between DEGs in cTECs and mTECs. (c) Percentages of DEGs for selected thresholds of mRNA expression fold-change (FC). Numbers of DEGs are indicated above bars.

