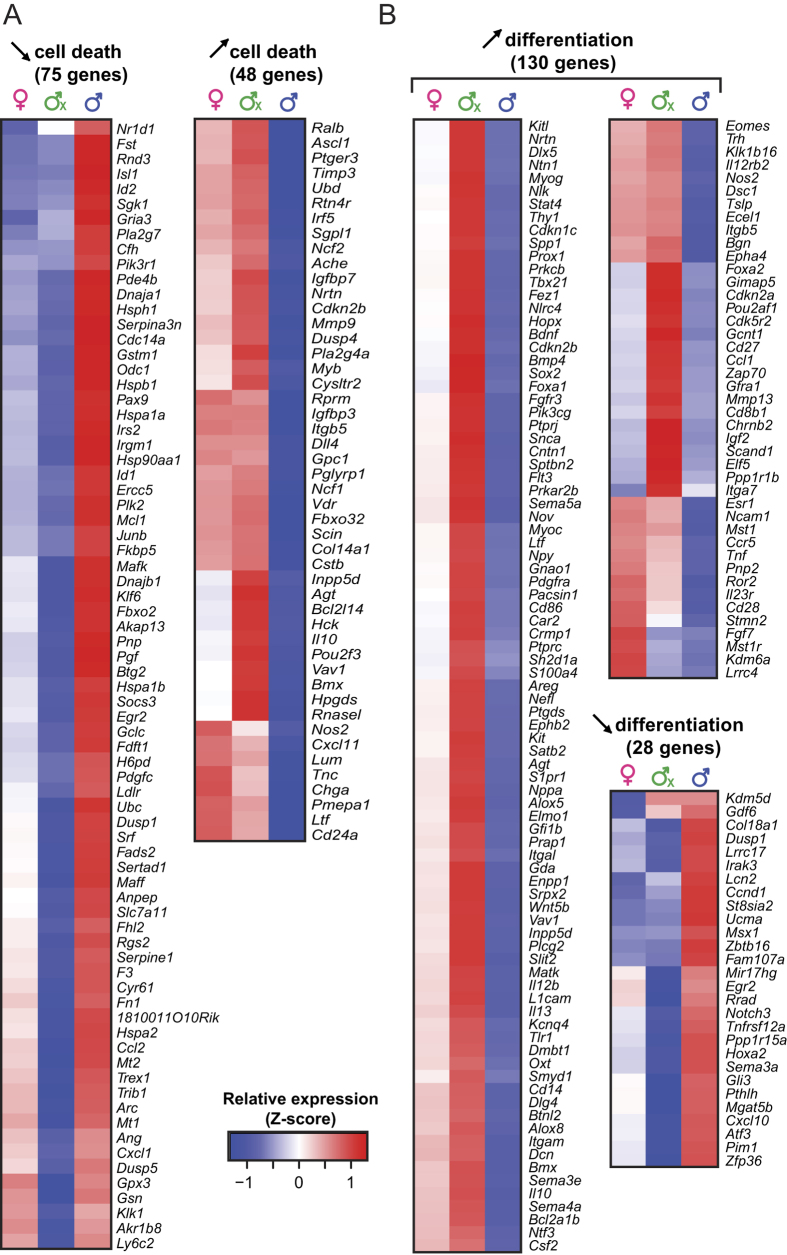
Figure 4. Relative expression of genes contributing to the inhibition of cell death and cell differentiation in male TECs.
(a) Relative expression of genes that affect cell death in cTECs. (b) Relative expression of genes that affect cell differentiation in mTECs. Relative gene expression is depicted as a Z-score, calculated separately for cTECs and mTECs. Red corresponds to higher expression, whereas blue corresponds to lower expression.

