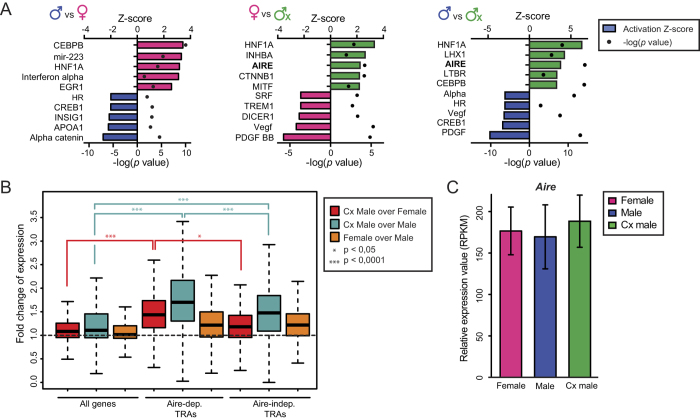
Figure 6. Cx males show higher expression of TRAs.
(a) Ten most activated upstream regulators predicted by IPA analysis of mTECs DEGs in female vs male (left), in Cx male vs female (center) and in Cx male vs male (right, all predicted activators shown are significant p < 0.05). The color of bars shows in which group a given upstream regulator is activated (e.g., blue = males). (b) Fold-difference in expression of all genes, Aire-dependent TRAs and Aire-independent TRAs in mTECs. The gene expression ratio (log2 RPKM) of Cx male over female is depicted in red, of Cx male over male in turquoise and of female over male in orange. (c) Relative expression of Aire in mTECs (RPKM).

