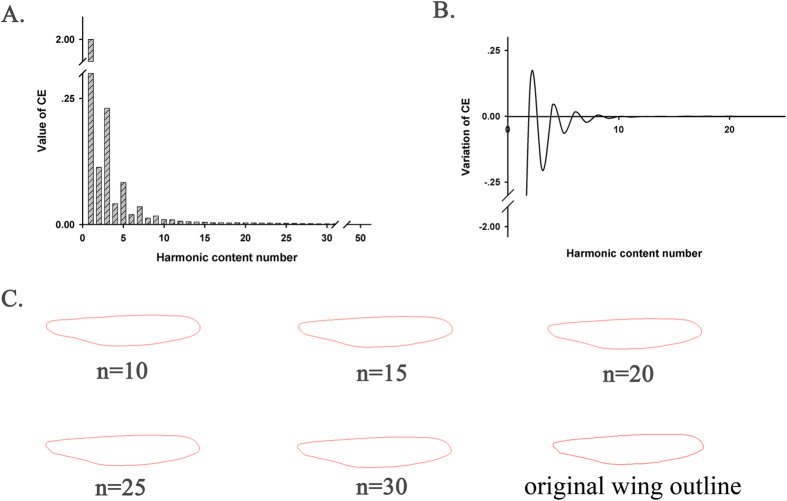
Figure 1. Relationship between the descriptive precision of a reconstructed wing outline and the harmonic content number.
(A) A histogram demonstrates that the values of the Elliptic Fourier descriptor (CE) change with increasing harmonic content numbers. (B) A wave line demonstrates that the variation in CE declines with increasing harmonic content numbers. (C) Wing outlines reconstructed from the first 10, 15, 20, 25, and 30 harmonics and the original outline.

