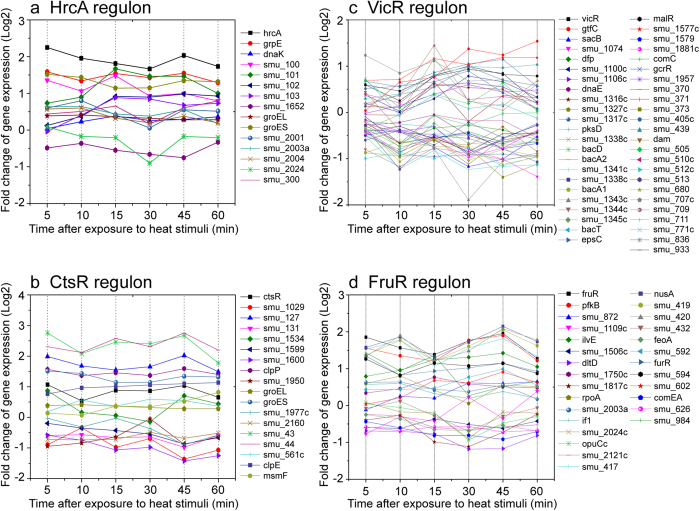
Figure 4. Transcriptional profiles of genes modulated by selected transcription factors under heat stress in S. mutans.
Line graphs show the normalized expression profiles of DEGs regulated by HrcA (a), CtsR (b), TCS response regulator VicR (c) and global regulator FruR (d) at 5, 10, 15, 30, 45, and 60 min at 42 °C relative to 37 °C.

